. 2025 Jun;61(12):e70168.
doi: 10.1111/ejn.70168.

Paraventricular Nucleus of the Thalamus Neurons That Project to the Nucleus Accumbens Show Enhanced c-Fos Expression During Early-Stage Cue-Reward Associative Learning in Male Rats

Affiliations

Paraventricular Nucleus of the Thalamus Neurons That Project to the Nucleus Accumbens Show Enhanced c-Fos Expression During Early-Stage Cue-Reward Associative Learning in Male Rats

S Seeger-Armbruster et al. Eur J Neurosci. 2025 Jun.

Abstract

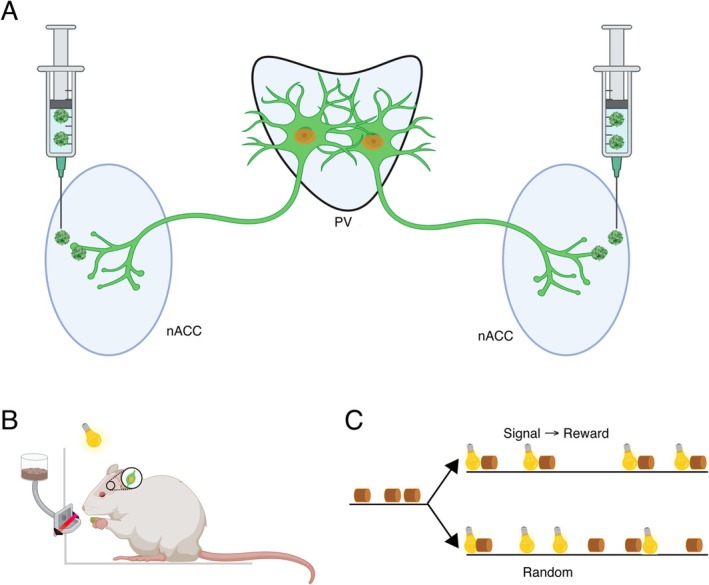
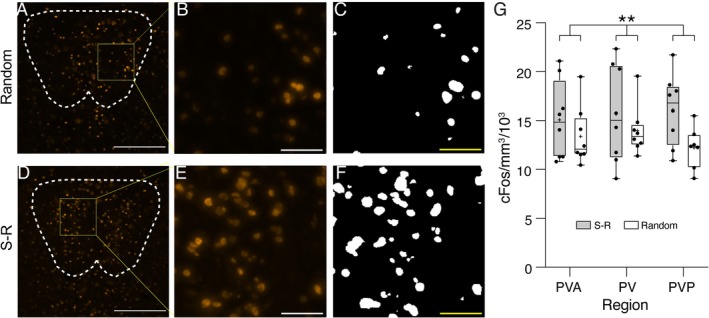
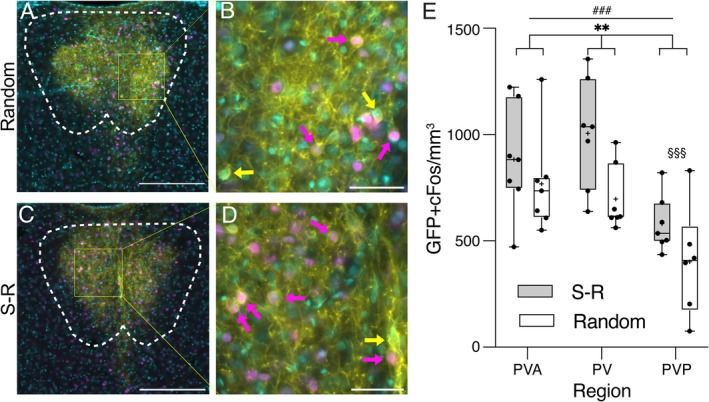
The paraventricular nucleus of the thalamus (PVT) is a central node in brain networks controlling motivated behaviors. It processes inputs from cerebral cortex, brainstem, and hypothalamus and has efferents that project to a wide range of structures, including the nucleus accumbens (nAcc). It is known that PVT neurons projecting to the nAcc show c-Fos activation in response to reward-related cues, in well-trained animals. We previously found that c-Fos expression is also increased early in the conditioning process, during the first session of learning a new cue-reward association in rats, but neurons with projections to nAcc were not identified in that study. Here, we tested the hypothesis that nAcc-projecting PVT neurons would show this enhanced c-Fos expression following first exposure to the association of a visual cue with a subsequent food reward. Male rats were stereotaxically injected in the nAcc with a retrogradely transported adeno-associated virus construct leading to green fluorescent protein (GFP) expression in cell bodies of afferents from PVT. Following a single session of cue-reward training, processing of the brains with dual immunohistochemistry for c-Fos and GFP showed significantly higher density of double labelled neurons in the conditioned group, compared to controls in which the same number of cues and rewards were delivered at random intervals with respect to each other. Such activation of immediate early gene expression in PVT to nAcc projecting neurons very early in paired associative reward learning may have a role in modulating plasticity in the nAcc.

Keywords: immediate early gene; midline thalamus; retrograde adeno‐associated viral vector.


Conflict of interest statement

The authors declare no conflicts of interest.

Figures

FIGURE 1
FIGURE 1
Experimental overview and design. (A) Bilateral injections of AAVrg‐Syn‐ChR2(H134R)‐GFP (green particles) into nucleus accumbens (nAcc) led to GFP expression (green) in paraventricular nucleus (PVT) neurons. Neurons were labelled for nuclear c‐Fos expression (orange). (B) In the baseline and main experiments, animals were exposed to various behavioral situations that could include delivery of food pellets (brown cylinder), light cues (yellow bulb), or no particular events. Food pellet retrieval was detected by infra‐red beam interruption (red bar across feeder entrance). (C) Behavioral situations for the main experiment. Pretraining involved random delivery of food pellet rewards. Rats were then split into two groups; in the signal→reward group, food delivery was preceded by a light cue at a constant interval, whereas in the random (control) group, food and lights were delivered at random times relative to each other. Created with BioRender.com.
FIGURE 2
FIGURE 2
c‐Fos positive nuclei in the baseline experiment. (A) Histological transverse sections at the level of mid PVT (AP ‐2.4; PV) from three different rats showing typical nuclear staining for c‐Fos (orange) following exposure to each of the three behavioral contexts. Scale bars 250 μm. DAPI staining in blue. 3 V, third ventricle. For this illustration only (not for analysis), c‐Fos staining appearance has been enhanced by assigning “hot orange” to the channel, instead of orange. (B) Box and whiskers plot shows all data points (black dots), median (horizontal line) and mean (+ symbol) density of c‐Fos labelled nuclei (in thousands/mm3) for rats in chamber only (C, white bars), chamber + light (CL, striped bars), and chamber + reward (CR, grey bars) groups, split by PVT region (PVA, anterior; PV, mid; PVP, posterior). Box shows 25th to 75th percentiles, and whiskers mark minimum and maximum values. Two‐way ANOVA revealed no significant main effects or interaction. (C) Graph shows mean ± SEM density of c‐Fos nuclei for the three groups, pooled across PVT regions. (D) Graph shows mean ± SEM c‐Fos nuclei density for the three PVT regions, pooled across groups.
FIGURE 3
FIGURE 3
Behavioral performance in the main experiment. (A) Pre‐training. Graph shows the number of retrieved rewards per session for each rat in all pre‐training sessions. Dotted horizontal line indicates the 70 trials per session threshold defined as successful learning of the food‐retrieval aspect of the task. (B) Graph shows mean ± SEM of data in (A), split by group (SR (signaled reward), gray circles and line; random, white squares and dashed line. Solid horizontal line and **** indicate p < 0.0001 for the main effect of Training Session (two‐way ANOVA). ### p < 0.001 compared to each other session 2–5; §, p < 0.05 compared to session 4; ¶¶¶ p < 0.001 compared to session 5; £ p < 0.05 compared to session 5, Holm‐Šidák post hoc tests. (C) Box and whiskers plot shows all data points (black dots), median (horizontal line) and mean (+ symbol) of first nose poke latencies for the first and last 10 trials of the experimental session for S‐R (gray) and random (white) groups. Box shows 25th to 75th percentiles, and whiskers mark minimum and maximum values.
FIGURE 4
FIGURE 4
GFP‐expression in nAcc and PVT following virus injections in the nAcc. (A) Coronal section labelled for GFP (green) and DAPI (blue) from a rat showing GFP expression at the injection site in the nAcc in both hemispheres. The anteroposterior level of sections relative to bregma (Paxinos and Watson 2009) is indicated bottom left. Scale bar = 500 μm. nAccC, nucleus accumbens core; nAccSh, nucleus accumbens shell. B‐D. Representative sections from the same rat in (A) through each of the sub‐regions of the PVT (scale bars = 250 μm in each panel) showing bilateral retrograde labelling in (B) anterior (PVA), (C) mid (PV), and (D) posterior PVT (PVP). Inset in (C) shows enlarged region to illustrate GFP in cell bodies (arrows). (E) Coronal section from a rat in which injection was only successful on one side, showing GFP labelling limited to the right nAcc. Scale bar = 500 μm. (F–H) Sections from the same rat as in (E) show lateralized labelling in PVT sub‐regions (scale bars = 250 μm in each panel). (I) Box and whiskers plot shows all data points (black dots), median (horizontal line), and mean (+ symbol) density of GFP‐labelled cells for rats in S‐R (gray bar) and random (white bar) groups, split by PVT regions. Box shows 25th to 75th percentiles, and whiskers mark minimum and maximum values. Horizontal bar and *** indicate significant main effect of Region (p < 0.001, two‐way ANOVA). Post hoc analysis is shown in (J). There was no effect of Group or interaction. (J) Graph shows post hoc analysis of the main effect of Region on mean + SEM density of GFP labelled cells from (I), pooled across group. **p < 0.01, ***p < 0.001, Holm‐Šidák post hoc tests.
FIGURE 5
FIGURE 5
Enhanced c‐Fos activation in PVT following exposure to visual stimuli paired with reward. (A) Image shows a PVT section from a typical random group rat, at AP − 2.52 mm from bregma (Paxinos and Watson 2009) stained for c‐Fos (orange). Scale bar = 250 μm. (B) Enlargement of the region in box in (A). Scale bar = 50 μm. (C) Image shows the output of the ImageJ Particle Analysis selection channel, indicating (white) nuclei assessed as c‐Fos positive for the region in (B). Scale bar (yellow, to separate from selection output) = 50 μm. (D) A PVT section at the same anteroposterior coordinate as (A), from a typical S‐R group rat. Scale bar = 250 μm. (E) Zoom in on box in (D). Scale bar = 50 μm. (F) Output of the selection channel for the region in (E). Scale bar (yellow) = 50 μm. (G) Box and whiskers plot shows all data points (black dots), median (horizontal line), and mean (+ symbol) density of c‐Fos‐labelled nuclei (in thousands/mm3) for S‐R (gray bars) and random (white bars) groups, split by PVT region. Box shows 25th to 75th percentiles, and whiskers mark minimum and maximum values. **p < 0.01 main effect of Group, two‐way ANOVA.
FIGURE 6
FIGURE 6
c‐Fos activation in PVT neurons projecting to nAcc. (A) Example image of a PVT section at AP ‐2.52 mm from bregma (Paxinos and Watson 2009) from a random group rat. To improve contrast of overlapping color regions in the three‐color images in this figure, the GFP channel was set to yellow, c‐Fos to magenta, and DAPI to cyan. Thus c‐Fos positive nuclei in GFP positive neurons show as pink surrounded by yellow cytoplasm/membrane, whereas c‐Fos negative nuclei in GFP positive neurons show as light green surrounded by yellow. Scale bar = 250 μm. (B) Enlargement of the region in box in (A). Magenta arrows indicate examples of neurons co‐labelled with c‐Fos and GFP, yellow arrows indicate neurons only labelled with GFP. Scale bar = 50 μm. (C) Example image of a PVT section from a S‐R group rat. Scale bar = 250 μm. (D) Enlargement of region in (C). Scale bar = 50 μm. (E) Box and whiskers plot shows all data points (black dots), median (horizontal line), and mean (+ symbol) density of cells double‐labelled with GFP and c‐Fos. Box shows 25th to 75th percentiles, and whiskers mark minimum and maximum values, for S‐R (gray bar) and random (white bar) groups split by PVT region. **p < 0.01 for main effect of Group, ### p < 0.001 for main effect of Region (two‐way ANOVA), §§§ p < 0.001 for PVP compared to both PVA and PV, Holm‐Šidák post hoc tests.

Similar articles

References

    1. Barson, J. R. , Mack N. R., and Gao W. J.. 2020. “The Paraventricular Nucleus of the Thalamus Is an Important Node in the Emotional Processing Network.” Frontiers in Behavioral Neuroscience 14: 598469. - PMC - PubMed
    1. Brown, E. E. , Robertson G. S., and Fibiger H. C.. 1992. “Evidence for Conditional Neuronal Activation Following Exposure to a Cocaine‐Paired Environment: Role of Forebrain Limbic Structures.” Journal of Neuroscience 12: 4112–4121. - PMC - PubMed
    1. Choi, D. L. , Davis J. F., Fitzgerald M. E., and Benoit S. C.. 2010. “The Role of Orexin‐A in Food Motivation, Reward‐Based Feeding Behavior and Food‐Induced Neuronal Activation in Rats.” Neuroscience 167: 11–20. - PubMed
    1. Choi, E. A. , Jean‐Richard‐Dit‐Bressel P., Clifford C. W. G., and McNally G. P.. 2019. “Paraventricular Thalamus Controls Behavior During Motivational Conflict.” Journal of Neuroscience 39: 4945–4958. - PMC - PubMed
    1. Conte, W. L. , Kamishina H., and Reep R. L.. 2009. “The Efficacy of the Fluorescent Conjugates of Cholera Toxin Subunit B for Multiple Retrograde Tract Tracing in the Central Nervous System.” Brain Structure & Function 213: 367–373. - PubMed

Substances

LinkOut - more resources