. 2025 Jun 30;39(12):e70739.
doi: 10.1096/fj.202401856RRR.

Mitochondria-Homing Drug Mitochonic Acid 5 Improves Barth Syndrome Myopathy in a Human-Induced Pluripotent Stem Cell Model and Barth Syndrome Drosophila Model

Affiliations

Mitochondria-Homing Drug Mitochonic Acid 5 Improves Barth Syndrome Myopathy in a Human-Induced Pluripotent Stem Cell Model and Barth Syndrome Drosophila Model

Yoshiyasu Tongu et al. FASEB J. .

Abstract

Barth syndrome (BTHS) is a rare disease caused by mutations in the tafazzin gene that affects the heart and muscles; however, to date, no clinically effective drugs are available. In BTHS, mitochondrial function is reduced owing to changes in cardiolipin metabolism. We developed mitochonic acid 5 (MA-5), a small-molecule compound that increases ATP levels, improves mitochondrial dynamics, and is effective in treating mitochondrial and muscle diseases. Therefore, this study examined the effectiveness of MA-5 in treating BTHS. The mitochondrial functions of four isolated BTHS skin fibroblasts were examined. Human BTHS induced pluripotent stem cell (iPSC) were differentiated into myoblasts and cardiolipin metabolism and mitochondrial functions were analyzed. RNA-seq was performed to clarify the metabolic changes. Using a Drosophila melanogaster model of BTHS, the effects of MA-5 on motor performance and cardiac phenotype were examined. MA-5 improved mitochondrial function and reduced cell death due to oxidative stress in skin fibroblasts of patients with BTHS. MA-5 promoted ATP production and reduced oxidative stress in human BTHS iPS cell-derived myoblasts. RNA-seq analysis revealed that MA-5 alleviated endoplasmic reticulum stress in BTHS cells. Administration of MA-5 to BTHS Drosophila improved locomotor ability and tachycardia observed in patients with BTHS. Protein interaction analyses suggested colocalization of ATPase and the MA-5-binding protein mitofilin. These data suggested that MA-5 improves BTHS dysfunction and may serve as a novel therapeutic agent for BTHS.

Keywords: Drosophila; ATP; Barth syndrome; cardiolipin; iPS; mitochondria.


Conflict of interest statement

The authors have nothing to report.

The authors declare no conflicts of interest.

Figures
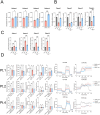
FIGURE 1
FIGURE 1
Mitochondrial abnormalities in skin fibroblasts derived from patients with BTHS. Experiments using skin fibroblasts derived from four human patients. (A) ATP levels in fibroblasts of patients with BTHS were measured. (B) Cell viability and (C) LDH levels were measured after treatment with the glutathione synthesis inhibitor BSO (n = 4). (D) OXPHOS and glycolysis results from extracellular flux analysis of fibroblasts from three patients with BTHS (n = 3). Oligo, oligomycin; FCCP, carbonyl cyanide‐4‐(trifluoromethoxy)phenylhydrazone; A/R, antimycin plus rotenone. Data are expressed as mean ± SD. Data were analyzed using one‐way ANOVA with Tukey's test. *p < 0.05, **p < 0.01, ***p < 0.001.
FIGURE 2
FIGURE 2
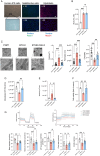
Experiments with disease model hiPSC‐derived myoblasts. (A) Human iPSCs were differentiated into myoblasts via myo‐precursor cells. Pax3/7, satellite‐like cell markers. MyoD1 as the differentiated myotube. Representative immunostaining of BTHS myoblasts. Scale bars = 50 μm. (B) The ratios of MLCL/CL were measured in control, BTHS, and MA‐5‐treated BTHS myoblasts (n = 3). (C) A representative image of electron microscopy analysis. Abnormal mitochondria with concentric cristae were observed in BTHS iPS‐derived myoblasts and MA‐5 (10 μM) ameliorated the abnormal morphology. Scale bar = 500 nm. The area, circularity, and perimeter were calculated using Image J (n = 11–34). Data were analyzed using one‐way ANOVA with Tukey's test. *p < 0.05, **p < 0.01, ***p < 0.001. (D) Myoblasts from normal control and patients with BTHS treated with DMSO or MA‐5 (10 μM) for 6 h, and MA‐5 increased ATP levels (n = 5–6). *p < 0.05, Student's t‐test. (E) Mitochondrial ROS was measured using MitoSox. Increased mitochondrial ROS levels were decreased with MA‐5 treatment (10 μM; n = 5–6). (F) Cell viability assay of iPSC‐derived myoblasts after 72 h‐DMSO application as control and 72 h‐MA‐5 at 10 μM treatment under 24 h‐BSO treatment‐induced oxidative stress in each myoblast (n = 5). (G) Mitochondrial function in BTHH iPS‐derived myoblast and control (PGP1), as assessed using the cellular OCR (oxygen consumption rate, pmol/min) and glycolysis using the extracellular acidification rate (ECAR, mpH/min) from extracellular flux analyzer (n = 14–15). Data were analyzed using one‐way ANOVA with Tukey's test. *p < 0.05, **p < 0.01, ***p < 0.001. The data represent the mean ± SD.
FIGURE 3
FIGURE 3
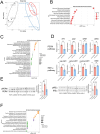
RNA‐seq analysis of BTHS iPS‐derived myoblasts. (A) PCA plot of differentially expressed genes among control, BTHH myoblasts, and BTHH myoblast+MA‐5. (B, C) MGI phenotype pathway analysis and Gene Ontology (GO) analysis with 74 overlapping genes identified through two criteria: Genes with p‐value < 0.005 and logFC > 0 in BTHH vs. control comparison, and genes with FDR p < 0.05 and logFC < 0 in MA‐5 vs. BTHH comparison. (D) Expression of ER stress‐related genes measured using RT‐PCR. For detecting effects on the PERK pathway, ATF4, CHOP, GPR94 and BIP (GPR78) expression levels were measured (upper panel). For detecting effects on the PERK and IRE1α pathways, the expression of XBP1 and its splice form were detected using quantitative real‐time PCR (RT‐PCR) (lower panel) (n = 3–4). (E) Western blot analyses of two ER stress‐related protein pPERK and pIRE1 expressions (n = 4). The relative expression was compared with total protein expression. (F) Gene Ontology (GO) analysis of 94 overlapping genes identified through two criteria: Genes with p‐value < 0.005 and logFC < 0 in BTHH vs. control comparison, and genes with FDR p < 0.05 and logFC > 0 in MA‐5 vs. BTHH comparison. Data were analyzed using one‐way ANOVA with Tukey's test. *p < 0.05, **p < 0.01, ***p < 0.001. Data are expressed as mean ± SD.
FIGURE 4
FIGURE 4
In vivo experiments with Drosophila TAZ‐knockout mutant. w 1118 flies were used as wild type (WT). Homozygous TAZ −/− flies were used as BTHS model. (A) The ratios of MLCL/CL in TAZ mutants were measured (n = 6 per group). (B) Climbing assay results and representative images of three groups (n = 10). (C) A representative transmission electron microscope (TEM) image (left panel) and mitochondrial image analysis (right panel) from skeletal muscle of Drosophila. TAZ deficiency also shows increase in the number of giant mitochondria with an onion‐like appearance [18, 51] (n = 6–11). Scale bars, 5 μm. (D) Heart rate change in BTHS model flies. Heartbeat plotted as a line graph (left panel). The heart rate was changed according to the copy number of TAZ gene (middle panel). Increased heart rate in BTHS model flies was reduced under MA‐5 treatment (right panel) (n = 5–8). The normal group refers to the group that received a normal diet with vehicle treatment. Welch's t‐test or one‐way ANOVA with Tukey's test was used to calculate significance. *p < 0.05, **p < 0.01, ***p < 0.001. n = 5 (WT), 5 (TAZ +/− ), 5 (TAZ −/− ) and 8 (TAZ −/−  + MA‐5) biologically independent samples. Data are expressed as mean ± SD.
FIGURE 5
FIGURE 5
Metabolomic analysis of BTHS Drosophila. (A) PCA plots of metabolomic analysis among WT with normal fed, TAZ−/− with normal fed (BTHS model), and TAZ−/− with MA‐5 fed. (B) Heatmap showed the metabolites that were significantly upregulated in the BTHS group and downregulated in the MA‐5 treatment group, extracted using p‐values (data were analyzed using one‐way ANOVA with Tukey's test) (C) Enrichment analysis with metabolites listed in Figure 5B. (D) Heatmap showed the metabolites significantly downregulated in the BTHS group and upregulated in the MA‐5 treatment group, extracted by p‐value (one‐way ANOVA with Tukey's test). (E) Enrichment analysis with metabolites listed in Figure 5D.
FIGURE 6
FIGURE 6
(A) Immunoprecipitation of mitofilin binding proteins. (B) Database search for mitofilin binding protein using the STRING database. (C) Western blotting of the submitochondrial vesicle (SMV) fraction. Left panel; IMMT antibody, Right panel Total OXPHOS Rodent WB antibody Cocktail. (D) GST pull down assay. Deletion mutants of mitofilin (left panel) and ATleP5A1 (right panel) were constructed, and the binding of GST‐mitofilin deletion mutants and ATP5A1 deletion mutants was examined. MTS, mitochondrial targeting sequence. (E) Effect of MA‐5 on the interaction between mitofilin and ATP5A1. CBB, Coomassie Brilliant Blue.

Similar articles

References

    1. Steward C. G., Groves S. J., Taylor C. T., et al., “Neutropenia in Barth Syndrome: Characteristics, Risks, and Management,” Current Opinion in Hematology 26 (2019): 6–15. - PMC - PubMed
    1. Barth P. G., Valianpour F., Bowen V. M., et al., “X‐Linked Cardioskeletal Myopathy and Neutropenia (Barth Syndrome): An Update,” American Journal of Medical Genetics, Part A 126A (2004): 349–354. - PubMed
    1. Jefferies J. L., “Barth Syndrome,” American Journal of Medical Genetics. Part C, Seminars in Medical Genetics 163C (2013): 198–205. - PMC - PubMed
    1. Clarke S. L., Bowron A., Gonzalez I. L., et al., “Barth Syndrome,” Orphanet Journal of Rare Diseases 8 (2013): 23. - PMC - PubMed
    1. Kang S. L., Forsey J., Dudley D., Steward C. G., and Tsai‐Goodman B., “Clinical Characteristics and Outcomes of Cardiomyopathy in Barth Syndrome: The UK Experience,” Pediatric Cardiology 37 (2016): 167–176. - PubMed

MeSH terms

LinkOut - more resources