. 2025 Dec;14(1):2518285.
doi: 10.1080/21623945.2025.2518285. Epub 2025 Jun 21.

FLOT chemotherapy treatment affects adipocyte's lipid metabolism: an in vitro study

Affiliations

FLOT chemotherapy treatment affects adipocyte's lipid metabolism: an in vitro study

Lisa Guerrier et al. Adipocyte. 2025 Dec.

Abstract

Cachexia is a complex syndrome that is often associated with cancer. Chemotherapy, one of the main cancer treatments, worsens weight loss in cancer-induced cachexia. In this context, it is thought that fat loss precedes muscle loss, and that alterations in adipose tissue are associated with tumours. However, the effect of cancer treatment on adipose tissue is not well understood. This study aimed to evaluate the impact of chemotherapy alone on mature 3T3-L1 adipocytes to identify the mechanisms contributing to adipose tissue alteration. The murine cell line 3T3-L1, a model of mature adipocytes, was used in this study. After differentiation, cells were treated for 48 h with a chemotherapy cocktail called FLOT composed of 5-fluorouracil, leucovorin, oxaliplatin and docetaxel at two concentrations (FLOT 1X and 0.1X). The control group was treated with the vehicle of the chemotherapy cocktail. Viability, mitochondrial function and dynamics, lipid metabolism, and cellular stress were also evaluated. FLOT 1X chemotherapy significantly reduced viability of mature 3T3-L1 cells and inhibited lipid accumulation. Interestingly, while FLOT 1X treatment downregulated lipogenesis markers, FLOT 0.1X treatment upregulated some of them. Although, the treatment showed no effect on mitochondrial respiration or density, it significantly increased expression of oxidative stress and inflammation markers in adipocytes.This in vitro study provides the first evidence of FLOT chemotherapy's direct effects on healthy mature adipocytes. The results demonstrate significant treatment-induced reductions in cell viability along with dysregulation of both lipogenic and lipolytic pathways. These findings elucidate previously unrecognized mechanisms underlying adipose tissue dysfunction in cancer cachexia.

Keywords: FLOT; adipocytes; high resolution respirometry; lipid metabolism; mouse; reactive oxygen species.


Conflict of interest statement

No potential conflict of interest was reported by the author(s).

Figures

None
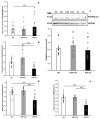
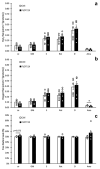
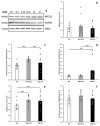
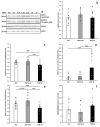
Graphical abstract
A bar histogram representing the %Cell viability according to five experimental conditions, control, H2O2, FLOT 0.01X, FLOT 0.1X and FLOT 1X. Cell viability is significantly decreased in the H2O2 and FLOT 1X conditions compared to control group.
Figure 1.
Effect of FLOT chemotherapy treatment on mature 3T3-L1 viability. Mature 3T3-L1 cells were treated for 48 h with the FLOT treatment at different concentrations of FLOT and H2O2 as a negative control of toxicity. Four independent experiments were performed with 2 to 6 technical replicates: ctrl (n = 19), H2O2 (n = 8), FLOT 0.01X (n = 10), FLOT 0.1X (n = 21), and FLOT 1X (n = 21). The results are presented as the mean percentage of the control ± S.E.M. Kruskal-Wallis test and Dunn test post-hoc, ***p < 0.001, *p < 0.05 versus control.
A bar histogram representing the %Red Oil O absorbance according to three experimental conditions, control, FLOT 0.1X and FLOT 1X. Absorbance is significantly decreased in the FLOT 1X condition compared to control group.
Figure 2.
Effect of FLOT chemotherapy treatment on lipid droplets accumulation in mature 3T3-L1. Mature 3T3-L1 were treated for 48 h with different FLOT treatment concentrations. Lipid droplets were stained with oil red O. Absorbance of the red oil O was measured at 500 nm. One independent experiment was performed with 12 technical replicates: ctrl (n = 12), FLOT 0.1X (n = 12), FLOT 1X (n = 12). The results are presented as the mean percentage of the control ± S.E.M. Kruskal-Wallis test and Dunn test post-hoc, ***p < 0.05 versus control.
Fig 3.A: Representative blots for PLIN1 at a molecular weight of 62 kDA, PNPLA2 at a molecular weight of 55 kDa and GAPDH at a molecular weight of 36 kDa. From left to right the conditions are control, control, FLOT 0.1X, FLOT 0.1 X, FLOT 0.1X, FLOT 1X and FLOT 1X. Fig 3.B: A bar histogram representing PNPLA2 protein levels according to three experimental conditions, control, FLOT 0.1X and FLOT 1X. There are no significant differences between the conditions. Fig 3.C: A bar histogram representing PLIN1 protein levels according to three experimental conditions, control, FLOT 0.1X and FLOT 1X. PLIN1 protein levels are decreased in FLOT 1X condition compared to control and FLOT 0.1X.
Figure 3.
Effect of FLOT chemotherapy treatment on lipid metabolism protein levels in mature 3T3-L1. Mature 3T3-L1 were treated for 48 h with different FLOT treatment concentrations. Four independent experiments were performed with 3 technical replicates (n = 12). (a) representative images of blots for PNPLA2 and PLIN1. Protein accumulations of PNPLA2 (b) and PLIN1 (c) normalized by ‘Ponceau’ red staining are presented according to treatment. The results are presented as the mean ± S.E.M., and each individual replicate is represented as a white dot. Kruskal-Wallis test and Dunn test post-hoc, ***p < 0.05 between groups.
Figure 4.
Figure 4.
Effect of FLOT chemotherapy treatment on lipid metabolism gene expression in mature 3T3-L1.Mature 3T3-L1 cells were treated for 48 h with different FLOT treatment concentrations. Five independent experiments were performed, with 3 technical replicates (n = 15). Gene expressions of Fasn (a), Dgat1 (b), Dgat2 (c), Cpt1a (d), and Cd36 (e) were normalized by Rplp0 gene expression. The results are presented as the mean ± S.E.M. and each individual replicate is represented as a white dot. Kruskal-Wallis test and Dunn test post-hoc, ***p < 0.05 between groups.
Figure 5.
Figure 5.
Effect of FLOT chemotherapy treatment on mitochondrial biogenesis, density and dynamics in mature 3T3-L1. Mature 3T3-L1 cells were treated for 48 h with different FLOT treatment concentrations. Four independent experiments were performed with 2 to 3 technical replicates (n = 11–15). Mitochondrial density was evaluated using the mitochondrial (mt-nd6) DNA per nuclear (Ndufb6) DNA ratio (a). Protein accumulation of PPARGC1A (c) was normalized by ‘Ponceau’ red staining and presented with a representative image of the blot. Gene expressions of Ppargc1a (b), Dnm1l (d), and Mfn1 (e) were normalized by Rplp0 gene expression. The results are presented as the mean ± S.E.M. and each individual replicate is represented as a white dot. Kruskal-Wallis test and Dunn test post-hoc, ***p < 0.05 between groups.
A bar histogram representing oxygen flux according to five respiratory states, cells, glutamate and malate, ADP, octanoyl-carnitine, and succinate, for two experimental conditions: control, and FLOT 1X. There are no differences in oxygen flux between conditions for all respiratory states presented.
Figure 6.
Effect of FLOT chemotherapy on mitochondrial respiration in mature 3T3-L1. Measurements were performed in presence of glutamate (G), malate (M), ADP (D), octanoyl-carnitine (O), and succinate (S) in mature 3T3-L1 after a 48 h treatment with FLOT 1X. Three independent experiments were performed with 1 to 3 technical replicates (n = 5 to 7). The results are presented as the mean ± S.E.M., and each individual replicate is represented as a white dot. Differences between the treated and control groups were assessed using the t-test, NS.
Figure 7.
Figure 7.
Effect of FLOT chemotherapy on mitochondrial ROS production and FRL in mature 3T3-L1. Measurements were performed in the presence of glutamate (G), malate (M), succinate (S), rotenone (Rot), ADP (D), and antimycin a (Ama). Three independent experiments were performed with 2 to 3 technical replicates (n = 6–7). Both H2O2 (a) and oxygen (b) fluxes are required for the free radical leak (FRL) calculation (c). The formula used is the following: H2O2 fluxes divided by twice O2 consumption with the result multiplied by 100. The results are presented as the mean ± S.E.M., and each individual replicate is represented as a white dot. Differences between the treated and control groups were assessed using the Wilcoxon rank-sum exact test, *p < 0.05.
Figure 8.
Figure 8.
Effect of FLOT chemotherapy treatment on mitochondrial antioxidant defense in mature 3T3-L1. Mature 3T3-L1 cells were treated for 48 h with different FLOT treatment concentrations. Four (B, E) to five (C, D, F) independent experiments were performed with 2 to 3 technical replicates (n = 11–15). (a) representative images of the blots for both SOD2 and NFE2L2. Protein levels of SOD2 (b) and NFE2L2 (e) were normalized by ‘Ponceau’ red staining. Gene expression of Sod2 (c), cat (d) and Nfe2l2 (f) were normalized by Rplp0 gene expression. Results are presented as the mean ± S.E.M., and each individual replicate is represented as a white dot. Kruskal-Wallis test and Dunn test post-hoc, ***p < 0.05 between groups.
Figure 9.
Figure 9.
Effect of FLOT chemotherapy treatment on inflammation and cell death in mature 3T3-L1. Mature 3T3-L1 cells were treated for 48 h with different FLOT treatment concentrations. Four (B, f) to five (C, D, E) independent experiments were performed with 2 to 3 technical replicates (n = 7–15). (a) representative images of the blots for CASP3 and total MAPK1/MAPK14. Protein levels of CASP3 (b) and MAPK1/MAPK14 (f) was normalized by ‘Ponceau’ red staining. Gene expressions of Casp3 (c), Il6 (d) and Tlr4 (e) were normalized by Rplp0 gene expression. The results are presented as the mean ± S.E.M., and each individual replicate is represented as a white dot. Kruskal-Wallis test and Dunn test post-hoc, ***p < 0.05 between groups.
Fig 10.A: Pre-adipocytes displaying a typical spindle-shaped morphology with elongated nuclei and an extended cytoplasmic network. Fig 10.B: Differentiated adipocytes characterized by a rounded morphology and the presence of numerous intracellular lipid droplets of varying sizes, visible as bright spherical structures.
Figure 10.
Differentiation of 3T3-L1 pre-adipocytes in mature adipocytes Pre-adipocytes at day 0 (a) and mature adipocytes with lipid droplets at day 8 of differentiation (b).
Figure 11.
Figure 11.
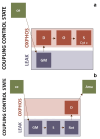
SUIT protocol for respirometry and fluorimetry analysis. The SUIT protocol is designed to explore mitochondrial respiration globally.The cells were permeabilized following detachment from the culture vials. After cell addition (ce), glutamate (G) and malate (M) were added to measure the CI-linked LEAK respiration. Both serve as donors of NADH,H+, a substrate of the respiratory chain complex I.A: To obtain the OXPHOS respiratory state, ADP (D) was added and converted to ATP, by ATP synthase. OXPHOS status was also measured in the presence of an additional substrate, octanoyl-carnitine (O), which is a carnitine-dependent β-oxidation substrate. To obtain maximal coupled oxidative capacity, succinate (S), a FADH2-based substrate was added to activate complex II. Finally, cytochrome c (c) was used to evaluate mitochondrial membrane integrity. B: This protocol allows for the evaluation of mitochondrial ROS production by converting the superoxide anion produced in H2O2 in the presence of SOD2. To ensure that every superoxide anion was converted to H2O2, SOD2 was added at the beginning of the experiment. The AmplexRed reaction with H2O2 is catalysed by HRP and produces the stable fluorescent compound; resorufin. After cell addition (ce), glutamate (G) and malate (M) were added to measure the CI-linked LEAK respiration and H2O2 production. Succinate (S) was added to measure the CI-CII-linked LEAK respiration, also called non-phosphorylating resting state. It also increases the membrane potential, provides redox power in the Q-junction, and is responsible for ROS production. The addition of rotenone (Rot) inhibits complex I, which blocks backward electron flow and allows measurement of the succinate pathway control state. ADP (D) was added to initiate OXPHOS. Antimycin A (Ama) was added to inhibit complex III, induce residual oxygen consumption, and also increase ROS production.

References

    1. Argilés JM, Busquets S, Stemmler B, et al. Cancer cachexia: understanding the molecular basis. Nat Rev Cancer. 2014;14(11):754–18. doi: 10.1038/nrc3829 - DOI - PubMed
    1. Evans WJ, Morley JE, Argilés J, et al. Cachexia: a new definition. Clin Nutr. 2008;27(6):793–799. doi: 10.1016/j.clnu.2008.06.013 - DOI - PubMed
    1. Baracos VE, Martin L, Korc M, et al. Cancer-associated cachexia. Nat Rev Dis Primer. 2018;4(1):17105. doi: 10.1038/nrdp.2017.105 - DOI - PubMed
    1. Peixoto Da Silva S, Santos JMO, Costa E, et al. Cancer cachexia and its pathophysiology: links with sarcopenia, anorexia and asthenia. J Cachexia Sarcopenia Muscle. 2020;11(3):619–635. doi: 10.1002/jcsm.12528 - DOI - PMC - PubMed
    1. Al-Batran S-E, Homann N, Pauligk C, et al. Perioperative chemotherapy with fluorouracil plus leucovorin, oxaliplatin, and docetaxel versus fluorouracil or capecitabine plus cisplatin and epirubicin for locally advanced, resectable gastric or gastro-oesophageal junction adenocarcinoma (FLOT4): a randomised, phase 2/3 trial. Lancet. 2019;393:1948–1957. doi: 10.1016/S0140-6736(18)32557-1 - DOI - PubMed

MeSH terms

LinkOut - more resources