. 2025 Jun 21;145(1):351.
doi: 10.1007/s00402-025-05957-y.

Why do orthopaedic surgeons get sued? An analysis of £2.2 billion in claims against NHS England: trends in litigation and strategies to enhance care

Affiliations

Why do orthopaedic surgeons get sued? An analysis of £2.2 billion in claims against NHS England: trends in litigation and strategies to enhance care

Saran Singh Gill et al. Arch Orthop Trauma Surg. .

Abstract

Background: Litigation in Orthopaedic Surgery poses a significant financial challenge to healthcare systems. Orthopaedic-related claims accounted for 10.8% of the 10,900 total claims in the NHS in 2023/24, costing approximately £250 million. Yet, no extended analysis of Orthopaedic-related litigation trends has been conducted. This study examined NHS litigation data from 1996/97 to 2023/24 identifying trends, causes, and financial impact to provide actionable insights for improving clinical practice.

Methods: Orthopaedic-related claims data from NHS Resolution (NHSR; 1996/97–2023/24) were analysed under the Freedom of Information Act. The dataset, focused on closed claims with settlements, included causes, injury types, and payouts. Broader classifications were applied due to GDPR constraints. Non-parametric distributions were confirmed using the Shapiro-Wilk test. Subsequent analyses, using the Kruskal-Wallis tests, calculated significant differences between categories and across years.

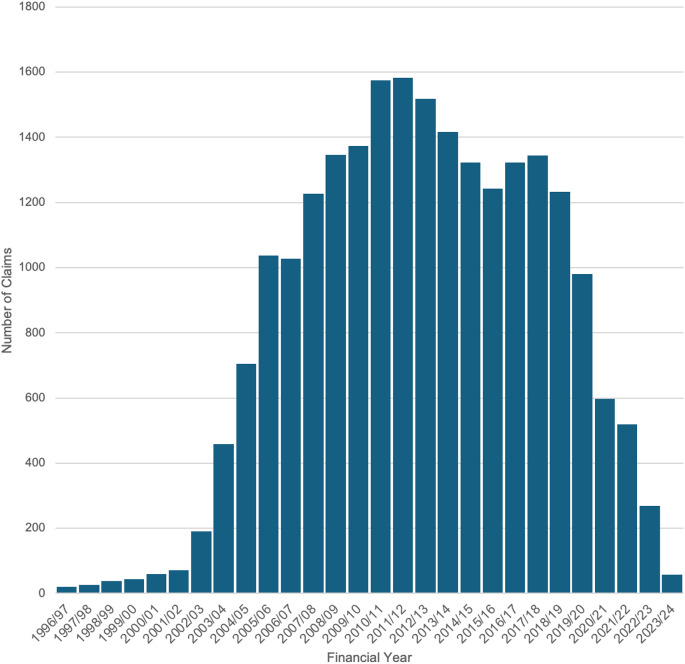
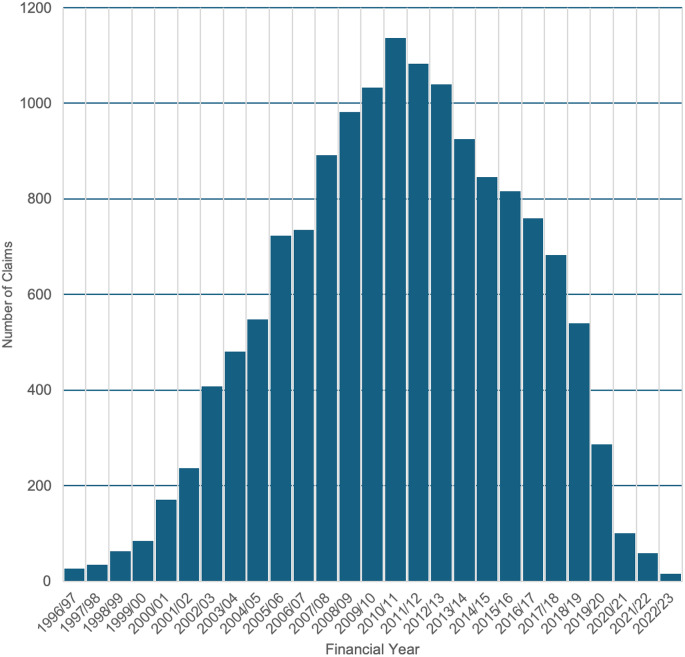
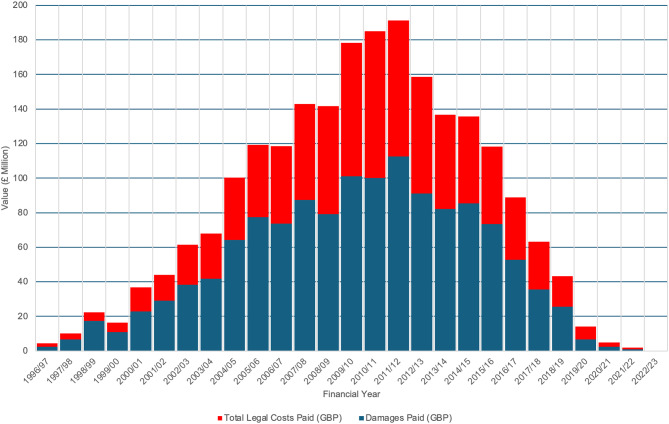
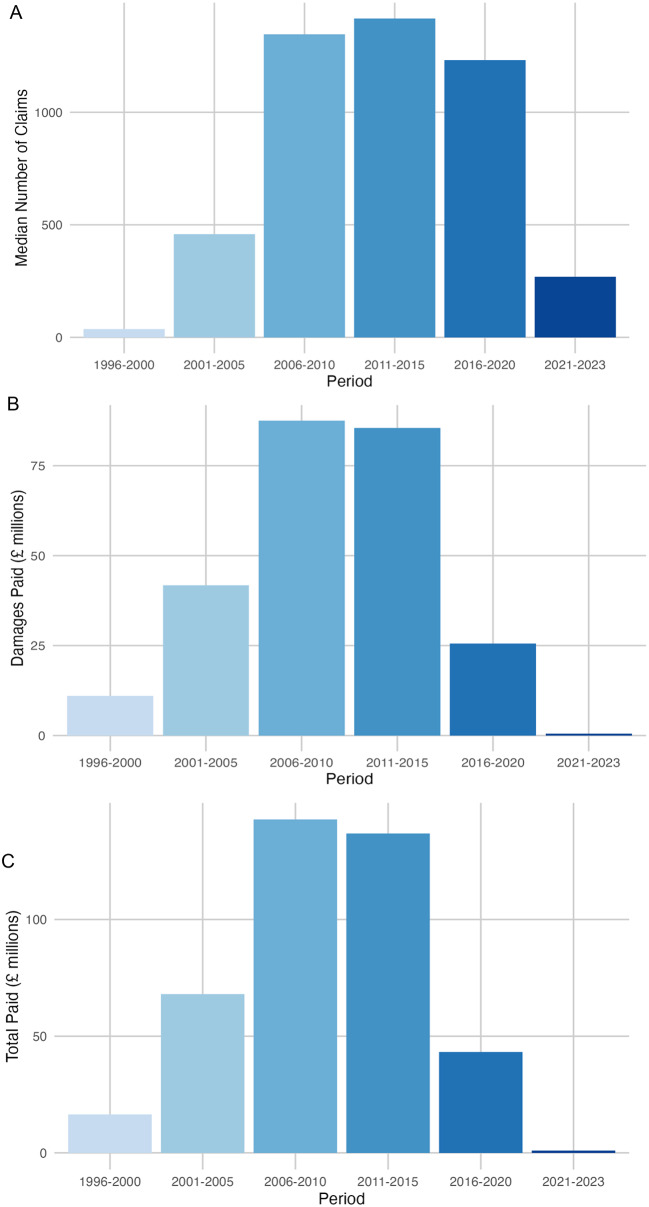
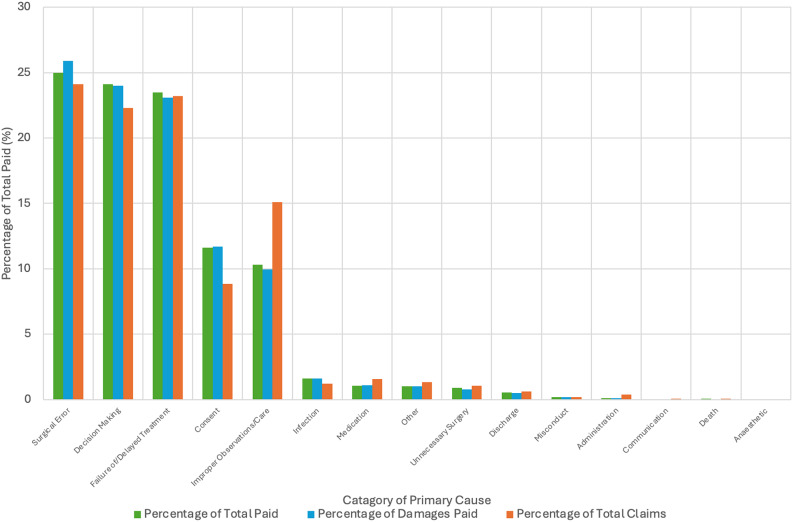
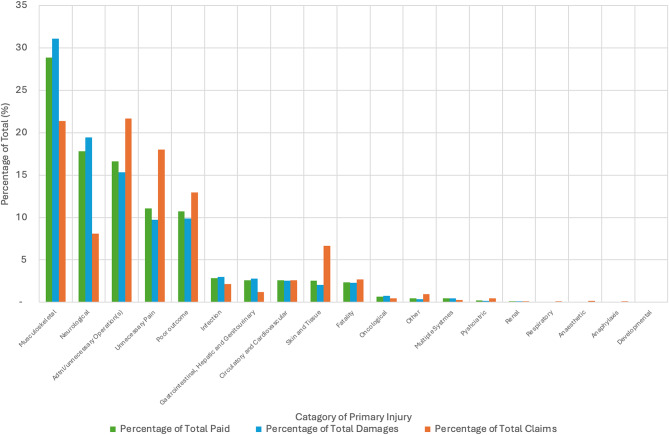
Results: Between 1996/97 and 2023/24, 22,606 clinical negligence claims resulted in 14,702 settlements exceeding £2.2 billion, including £1.2 billion in damages. Musculoskeletal injuries were most frequent primary injuries (21%, £407.53 million), followed by unnecessary operations and postoperative pain (22%, £328.27 million). Neurological issues (8%) and poor outcomes (13%) accounted for £254.74 million and £129.14 million, respectively. Surgical errors (24%) caused the highest damages of the primary causes (£309.47 million), followed by failure or delayed treatment (23%, £277.02 million) and decision-making errors (22%, £287.57 million). Settlement values peaked in the early 2010s before declining, with significant differences in median claims, damages, and total payouts per annum (p < 0.001).

Conclusion: Between 1996/97 and 2023/24, over £2.2 billion was paid in settlements, with £1.2 billion in damages. Musculoskeletal injuries, surgical errors, and delayed treatment were leading causes, highlighting persistent clinical challenges. Although claim volumes and payouts have declined since 2011/12, improved consent and multidisciplinary meetings may offer potential opportunities to enhance patient outcomes and reduce litigation against Orthopaedic Surgeons in the NHS.

Supplementary Information: The online version contains supplementary material available at 10.1007/s00402-025-05957-y.

Keywords: Legal; Litigation; Malpractice; NHS; Orthopaedics.


Conflict of interest statement

Declarations. Competing interests: The authors declare no competing interests.

Figures

Fig. 1
Fig. 1
Number of clinical claims and incidents received number of clinical claims and incidents received between financial years ‘2006/07’ and ‘2023/24’ where the incident date is between financial years ‘1996/97’ and ‘2023/24’ and the Specialty is ‘Orthopaedic Surgery’ The bar chart displays the number of claims by year of incident, illustrating a clear trend over time. The x-axis represents the Year of Incident, ranging from 1996/97 to 2023/24, and the y-axis represents the Number of Claims
Fig. 2
Fig. 2
Number of clinical claims closed (or settled with a periodical payment order) number of clinical claims closed (or settled with a periodical payment order) between financial years ‘2006/07’ and ‘2022/23’ with a damages payment, and where the incident date is between financial years ‘1996/97’ and ‘2022/23’ and the Specialty is ‘Orthopaedic Surgery’. The bar chart shows the number of closed claims by year of incident, highlighting the distribution and trends in closed claims over time. The x-axis represents the Year of Incident, spanning from 1996/97 to 2023/24, while the y-axis represents the Number of Closed Claims
Fig. 3
Fig. 3
Cost of clinical claims closed (or settled with a periodical payment order) between financial years ‘2006/07’ and ‘2022/23’ with a damages payment, and where the incident date is between financial years ‘1996/97’ and ‘2022/23’ and the Specialty is ‘Orthopaedic Surgery’. The bar chart represents the total amount paid by year of incident, showing the financial trends related to claims over time. The x-axis depicts the Year of Incident, ranging from 1996/97 to 2023/24, and the y-axis shows the total paid in millions of GBP. The red series represents the total paid out in each year, and the blue represents the damages paid per year
Fig. 4
Fig. 4
Trends in claims, damages paid, and total paid over 5-year periods. (A) Presents the median number of claims filed per 5-year period, with the x-axis representing the 5-year blocks and the y-axis showing the median number of claims. The black error bars represent the interquartile range (IQR), illustrating variability in claims filed within each period. This visualization helps assess whether the frequency of claims has increased, decreased, or remained stable over time. (B) Focuses on damages paid, scaled in millions of GBP, showing the median compensation amounts per 5-year period. The x-axis denotes the 5-year blocks, while the y-axis indicates the median damages paid. The IQR bars reflect fluctuations in compensation amounts, highlighting periods where damages payments exhibited greater variability. (C) Represents the median total amount paid, including damages and legal costs, for each 5-year period, also scaled in millions of GBP. The x-axis depicts the 5-year blocks, and the y-axis shows the median total paid. The black error bars indicate the IQR, emphasizing differences in total payouts across periods. This visualization captures financial trends in claims management, helping to assess the overall economic burden over time
Fig. 5
Fig. 5
Percentage of total closed claims, total damages paid and total payout by category of primary cause. This figure represents the distribution of total closed claims by category, expressed as a percentage, ordered by proportion of total damages paid Categories with higher percentages have a larger share of claims in the dataset. supplementary Table 1 outlines the breakdown by individual cause
Fig. 6
Fig. 6
Percentage of total closed claims, total damages paid and total payout by category of primary injury. This figure represents the distribution of total closed claims by category, expressed as a percentage organised in descending order by proportion of total damaged paid. Categories with higher percentages have a larger share of claims in the dataset. During the data reorganisation process, 21 rows with redacted data were identified, supplementary Table 2 outlines the breakdown by individual injury

Similar articles

References

    1. Salimi M, Heidari MB, Ravandi Z, Mosalamiaghili S, Mirghaderi P, Jafari Kafiabadi M et al (2023) Investigation of litigation in trauma orthopaedic surgery. World J Clin Cases 11(5):1000–1008 - PMC - PubMed
    1. Adelani MA, Hong Z, Miller AN (2023) Effect of lawsuits on professional Well-Being and medical error rates among orthopaedic surgeons. J Am Acad Orthop Surg 31(16):893–900 - PubMed
    1. Tingle J (2017) Making the NHS litigation authority more effective as NHS resolution. Br J Nurs 26(11):634–635 - PubMed
    1. NHS Resolutions Home - NHS Resolution. NHS Resolution. Available from: https://resolution.nhs.uk
    1. Annual report and accounts 2023/24 Advise / Resolve / Learn HC 73. Available from: https://resolution.nhs.uk/wp-content/uploads/2024/07/NHS-Resolution-Annu...

LinkOut - more resources