

A K+-Efflux Antiporter is Vital for Tolerance to Salt Stress in Rice
- PMID: 40542901
- PMCID: PMC12182547
- DOI: 10.1186/s12284-025-00815-2
A K+-Efflux Antiporter is Vital for Tolerance to Salt Stress in Rice
Abstract
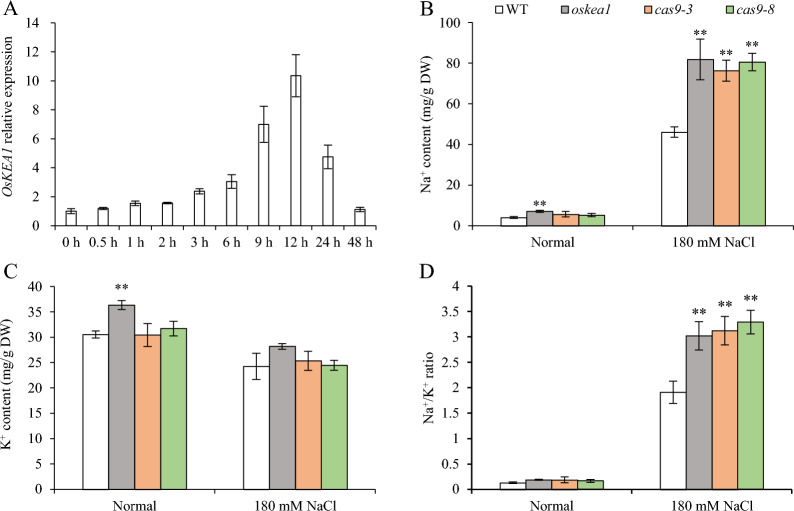
Salt damage significantly affects rice growth and development, posing a threat to food security. Understanding the mechanisms underlying rice's response to salt stress is crucial for enhancing its tolerance. This study aimed to elucidate the genetic and physiological mechanisms of rice adaptation to salt stress. We found that the expression of OsKEA1, a potassium (K+)-efflux antiporter gene in rice, was induced by salt. Both genetic and physiological experiments demonstrated that the mutation in OsKEA1 disrupted the Na+/K+ balance under salt stress conditions. Furthermore, OsKEA1 mutation exacerbated reactive oxygen species (ROS) accumulation, disrupted the antioxidant enzyme system, and compromised chloroplast integrity under salt stress. This study unveils the adaptive mechanisms of rice to salt damage and highlights the critical role of OsKEA1 in managing salt stress.
Keywords: OsKEA1; Chloroplast integrity and DNA damage; Na+/K+ and ROS balance; Rice; Salt stress.
© 2025. The Author(s).
Conflict of interest statement
Declarations. Competing Interests: The authors declare that they have no known competing financial interests or personal relationships that could have appeared to influence the work reported in this paper.
Figures


Similar articles
-
FKBP12-EBP1-Mediated Regulation of Salinity Tolerance in Rice.Plant Cell Environ. 2025 Aug;48(8):6285-6300. doi: 10.1111/pce.15583. Epub 2025 May 8. Plant Cell Environ. 2025. PMID: 40344235
-
Rice RING E3 Ligase OsRFP45 Negatively Regulates Salt Tolerance by Modulating Na+/K+ Transporter Genes.Physiol Plant. 2025 May-Jun;177(3):e70327. doi: 10.1111/ppl.70327. Physiol Plant. 2025. PMID: 40546069 Free PMC article.
-
TaHAK1 promotes salt tolerance via synergistic modulation of K+/Na+ ion homeostasis and auxin signaling in rice.Plant Physiol Biochem. 2025 Jul 26;228:110308. doi: 10.1016/j.plaphy.2025.110308. Online ahead of print. Plant Physiol Biochem. 2025. PMID: 40749473
-
Immunogenicity and seroefficacy of pneumococcal conjugate vaccines: a systematic review and network meta-analysis.Health Technol Assess. 2024 Jul;28(34):1-109. doi: 10.3310/YWHA3079. Health Technol Assess. 2024. PMID: 39046101 Free PMC article.
-
Fortification of salt with iron and iodine versus fortification of salt with iodine alone for improving iron and iodine status.Cochrane Database Syst Rev. 2022 Apr 21;4(4):CD013463. doi: 10.1002/14651858.CD013463.pub2. Cochrane Database Syst Rev. 2022. PMID: 35446435 Free PMC article.
References
-
- Álvarez-Aragón R, Rodríguez-Navarro A (2017) Nitrate-dependent shoot sodium accumulation and osmotic functions of sodium in Arabidopsis under saline conditions. Plant J 91(2):208–219 - PubMed
-
- Baxter A, Mittler R, Suzuki N (2014) ROS as key players in plant stress signalling. J Exp Bot 65(5):1229–1240 - PubMed
-
- Berni R, Luyckx M, Xu X, Legay S, Sergeant K, Hausman JF, Lutts S, Cai G, Guerriero G (2019) Reactive oxygen species and heavy metal stress in plants: impact on the cell wall and secondary metabolism. Environ Exp Bot 161:98–106
-
- Blumwald E (2000) Sodium transport and salt tolerance in plants. Curr Opin Cell Biol 12(4):431–434 - PubMed
LinkOut - more resources
Full Text Sources
