

Cost Efficiency of fMRI Studies Using Resting-State Vs. Task-Based Functional Connectivity
- PMID: 40543060
- PMCID: PMC12182254
- DOI: 10.1002/hbm.70260
Cost Efficiency of fMRI Studies Using Resting-State Vs. Task-Based Functional Connectivity
Abstract
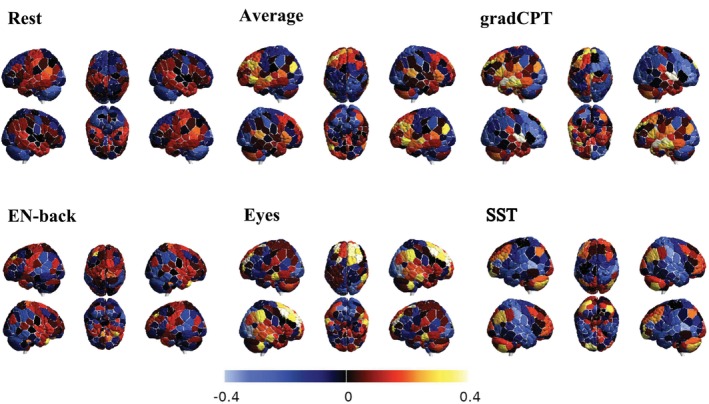
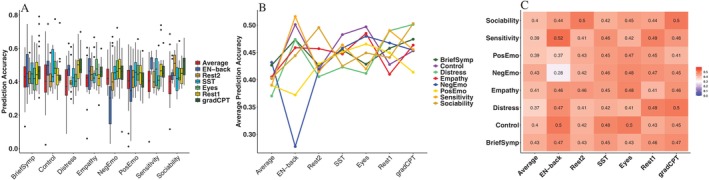
We investigate whether and how we can improve the cost efficiency of neuroimaging studies with well-tailored fMRI tasks. The comparative study is conducted using a novel network science-driven Bayesian connectome-based predictive method, which incorporates network theories in model building and substantially improves precision and robustness in imaging biomarker detection. The robustness of the method lays the foundation for identifying predictive power differentials across fMRI task conditions if such differences exist. When applied to a clinically heterogeneous transdiagnostic cohort, we find shared and distinct functional fingerprints of neuropsychological outcomes across seven fMRI conditions. For example, the emotional N-back memory task is found to be less optimal for negative emotion outcomes, and the gradual-onset continuous performance task is found to have stronger links with sensitivity and sociability outcomes than with cognitive control outcomes. Together, our results show that there are unique optimal pairings of task-based fMRI conditions and neuropsychological outcomes that should not be ignored when designing well-powered neuroimaging studies.
© 2025 The Author(s). Human Brain Mapping published by Wiley Periodicals LLC.
Figures


Similar articles
-
A cross-species analysis of neuroanatomical covariance sex differences in humans and mice.Biol Sex Differ. 2025 Jul 1;16(1):47. doi: 10.1186/s13293-025-00728-1. Biol Sex Differ. 2025. PMID: 40598550 Free PMC article.
-
Using an ordinary differential equation model to separate rest and task signals in fMRI.Nat Commun. 2025 Aug 3;16(1):7128. doi: 10.1038/s41467-025-62491-6. Nat Commun. 2025. PMID: 40753158 Free PMC article.
-
Unveiling the neural network of freezing of gait in Parkinson's disease: A coordinate-based network study.J Parkinsons Dis. 2025 Aug;15(5):982-989. doi: 10.1177/1877718X251348669. Epub 2025 Jun 19. J Parkinsons Dis. 2025. PMID: 40538160
-
Pathological laughter and crying: insights from lesion network-symptom-mapping.Brain. 2021 Nov 29;144(10):3264-3276. doi: 10.1093/brain/awab224. Brain. 2021. PMID: 34142117 Review.
-
Assessing the comparative effects of interventions in COPD: a tutorial on network meta-analysis for clinicians.Respir Res. 2024 Dec 21;25(1):438. doi: 10.1186/s12931-024-03056-x. Respir Res. 2024. PMID: 39709425 Free PMC article. Review.
Cited by
-
What is the best brain state to predict autistic traits?medRxiv [Preprint]. 2025 Jan 17:2025.01.14.24319457. doi: 10.1101/2025.01.14.24319457. medRxiv. 2025. PMID: 39867399 Free PMC article. Preprint.
References
-
- Barabási, A.‐L. 2013. “Network Science.” Philosophical Transactions of the Royal Society A: Mathematical, Physical and Engineering Sciences 371, no. 1987: 20120375. - PubMed
-
- Belgiu, M. , and Drăguţ L.. 2016. “Random Forest in Remote Sensing: A Review of Applications and Future Directions.” ISPRS Journal of Photogrammetry and Remote Sensing 114: 24–31.
-
- Blakemore, R. L. , and Vuilleumier P.. 2017. “An Emotional Call to Action: Integrating Affective Neuroscience in Models of Motor Control.” Emotion Review 9, no. 4: 299–309.
-
- Bushnell, E. W. , and Boudreau J. P.. 1993. “Motor Development and the Mind: The Potential Role of Motor Abilities as a Determinant of Aspects of Perceptual Development.” Child Development 64, no. 4: 1005–1021. - PubMed
MeSH terms
Grants and funding
- R01MH123245/MH/NIMH NIH HHS/United States
- RF1AG068191/NH/NIH HHS/United States
- P30AG072976/NH/NIH HHS/United States
- RF1AG081413/NH/NIH HHS/United States
- RF1 AG068191/AG/NIA NIH HHS/United States
- RF1 MH123245/MH/NIMH NIH HHS/United States
- R01EB034720/NH/NIH HHS/United States
- Alzheimer's Disease Data Initiative
- P30 AG072976/AG/NIA NIH HHS/United States
- R01MH120080/MH/NIMH NIH HHS/United States
- R01 EB034720/EB/NIBIB NIH HHS/United States
- William H. Gates Sr. Fellowship
- P30AG021342/NH/NIH HHS/United States
- RF1 AG081413/AG/NIA NIH HHS/United States
- P30 AG021342/AG/NIA NIH HHS/United States
LinkOut - more resources
Full Text Sources
Medical
