. 2025 Sep 4;188(18):4861-4879.e27.
doi: 10.1016/j.cell.2025.05.037. Epub 2025 Jun 20.

Scalable generation and functional classification of genetic variants in inborn errors of immunity to accelerate clinical diagnosis and treatment

Affiliations

Scalable generation and functional classification of genetic variants in inborn errors of immunity to accelerate clinical diagnosis and treatment

Zachary H Walsh et al. Cell. .

Abstract

Next-generation sequencing is pivotal for diagnosing inborn errors of immunity (IEI) but predominantly yields variants of uncertain significance (VUS), creating clinical ambiguity. Activated PI3Kδ syndrome (APDS) is caused by gain-of-function (GOF) variants in PIK3CD or PIK3R1, which encode the PI3Kδ heterodimer. We performed massively parallel base editing of PIK3CD/PIK3R1 in human T cells and mapped thousands of variants to a clinically important readout (phospho-AKT/S6), nominating >100 VUS and unannotated variants for functional classification and validating 27 hits. Leniolisib, an FDA-approved PI3Kδ inhibitor, rescued aberrant signaling and dysfunction in GOF-harboring T cells and revealed partially drug-resistant PIK3R1 hotspots that responded to novel combination therapies of leniolisib with mTORC1/2 inhibition. We confirmed these findings in T cells from APDS patients spanning the functional spectrum discovered in the screen. Integrating our screens with population-level genomic studies revealed that APDS may be more prevalent than previously estimated. This work exemplifies a broadly applicable framework for removing ambiguity from sequencing in IEI.

Keywords: APDS; CRISPR base editing; VUS; activated PI3K delta syndrome; clinical NGS; genome engineering; inborn errors of immunity; precision medicine; primary T cells; variant classification.


Conflict of interest statement

Declaration of interests B.I. and J.D.M. received research support from Pharming. B.I. is a consultant for or has received honoraria from Volastra Therapeutics, Johnson & Johnson/Janssen, Novartis, GSK, EISAI, AstraZeneca, and Merck and has received research funding to Columbia University from Agenus, Alkermes, Arcus Biosciences, Checkmate Pharmaceuticals, Compugen, Immunocore, Regeneron, and Synthekine. J.D.M. is on the scientific advisory board for Blueprint Medicine and receives grant funding from Pharming.

Figures
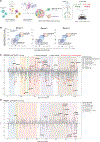
Figure 1.
Figure 1.. Saturation adenine base editor screening of PIK3CD and PIK3R1 coupled with a clinically informed GOF/LOF classification assay
(A) Schematic for adenine base editing (ABE) screening of PIK3CD and PIK3R1 in primary T cells. (B) FACS sort criteria for pAKT/pS6 screens. Stimulated T cells were binned into the top and bottom 15% of pAKT (pS473) and pS6 (pS235/pS236) expression. (C and D) (C) Lollipop plots for PIK3CD and (D) PIK3R1 annotated with protein domains and regions from UniProt showing log2(Fold Change) (LFC) of base editing sgRNAs in the pAKT/pS6 high vs. negative screen. LFCs across N = 3 healthy human T cell donors calculated with MAGeCK. Each point represents an sgRNA and is mapped to the sgRNA-targeted locus. Circles represent missense variants, while “X”s represent splice-site perturbations (SA, splice acceptor; SD, splice donor). Significantly enriched or depleted sgRNAs with a two-sided p < 0.05 in MAGeCK test are shaded red and known pathogenic variants are annotated with stars. Select amino acid conversions are annotated for highly enriched and depleted sgRNAs. Related to Figures S1, S2, and S3.
Figure 2.
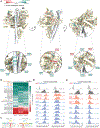
Figure 2.. Base editor screens enable robust functional classification of novel GOF and LOF variants
(A) Solved structure of the PI3Kδ protein complex. PIK3CD protein product p100δ is shaded yellow and PIK3R1 protein product p85 is shaded gray. Green and red shading represents sgRNAs with highly positive or negative LFC in the pAKT/pS6 screen, respectively, mapped to the targeted residue. LFC is integrated across N = 3 human donors. Shading darkness represents magnitude of LFC. Select enriched and depleted variants are annotated. An sgRNA FDR cutoff of <0.8 was used for visualization. (B) Heatmap of variant effects from pAKT/pS6 screens in each of N = 3 human donors. Variants shown were selected for downstream arrayed validation experiments. Variants are color coded as ClinVar Pathogenic (orange), ClinVar VUS/conflicting interpretation of pathogenicity (blue), or previously unannotated (black). For sgRNAs which are predicted to generate more than one variant (indicated by multiple variants separated by an underscore), each variant is color coded individually. (C) Representative chromatograms from next-generation sequencing of T cells base edited with indicated variants. Chromatogram trace of the targeted base is shaded red and percent base editing is annotated. (D and E) (D) Representative flow cytometry histograms of pAKT (pS473) and pS6 (pS235/pS236) in T cells base edited with known or putative gain-of-function (GOF) and (E) loss-of-function (LOF) variants discovered in the pAKT/pS6 screen, after 20-min CD3/CD28 stimulation in the presence of DMSO vehicle control. Histograms are representative of replicates from full experiment in Figures 3A–3D. Known GOF and LOF variants are shaded red and newly classified variants are shaded blue. MFI, median fluorescence intensity; FMO, fluorescence-minus-one control; and NT-sgRNA, non-targeting control sgRNA. Related to Figures S3 and S4.
Figure 3.
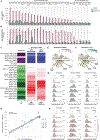
Figure 3.. PI3Kδ signaling effects and leniolisib sensitivity of novel GOF and LOF variants discovered in screens
(A and B) (A) MFI of pAKT (pS473) and (B) percent cells positive for pS6 (pS235/pS236) in T cells base edited with PIK3CD or PIK3R1 variants or a NT-sgRNA. T cells were either unstimulated, stimulated for 20 min in the presence of DMSO vehicle control, or stimulated for 20 min in the presence of 100 nM leniolisib (Len). Dotted line represents mean of replicates for the stimulated plus DMSO condition for control NT-sgRNA T cells. n = 3 biological replicates. (C) Heatmap of variant effects in pAKT/pS6 screen (normalized LFC of N = 3 donors, left), and in arrayed phospho-flow cytometry validation experiments (normalized pS6 pS235/pS236 percent positive, middle; normalized pAKT pS473 MFI, right; and all values from 20-min stimulation plus DMSO condition). n = 3 biological replicates for validation experiments with each variant are shown as individual rows. (D) Scatterplot of variant effects in arrayed validation experiments (pAKT pS473 MFI, y axis) and pAKT/pS6 screens (LFC, x axis). Dot sizes scaled by screen p value. (E and F) PIK3CD and PIK3R1 variant effects in validation experiments in (A and B) mapped to the solved structure of PI3Kδ: (E) Normalized pAKT (pS473) MFI with 20-min stimulation plus DMSO, (F) Normalized pS6 (pS235/pS236) % positive with 20-min stimulation plus Len. (G) Representative flow cytometry histograms for pS6 (pS235/pS236) across indicated conditions for GOF variants identified to be fully Len-sensitive or (H) partially Len-resistant. One-way ANOVA with Dunnett’s test for multiple comparisons in (A) and (B), performed for the Stimulated + DMSO condition comparing all variants with the NT-sgRNA control (*p < 0.05). Error bars represent mean ± standard deviation. Simple linear regression in (D). All results repeated in at least N = 3 healthy human donors. Related to Figure S6.
Figure 4.
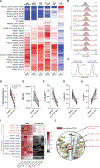
Figure 4.. Phenotypic consequences of novel GOF and LOF variants, correction with Len, and discovery of GOF variants with partial Len resistance
(A) Heatmap of normalized expression level for pAKT (pS473), pS6 (pS235/pS236), TCF, TOX, PD1, and CTLA4 for T cells engineered with PIK3CD or PIK3R1 variants or a control NT-sgRNA. For pAKT and pS6, cells were stimulated for 20 min. For TCF, TOX, PD1, and CTLA4, cells were activated and expanded for 10 days. n = 3 biological replicates for each variant are shown as individual rows. (B) Representative flow cytometry histograms for TOX for selected variants from (A). (C) Representative flow cytometry histograms for TOX for a representative Len-resistant (PIK3R1 p.L573P) and Len-sensitive (PIK3CD p.C416R) GOF variant, stimulated and expanded for 10 days in the presence of DMSO vehicle control or 100 nM Len. (D–H) Expression of (D) pS6 (pS235/pS236), (E) TOX, (F) CTLA4, (G) PD1, and (H) TCF in T cells engineered with GOF variants or NT-sgRNA and stimulated in the presence of either DMSO vehicle control or 100 nM Len. Each point represents mean of n = 3 biological replicates for each variant, with connecting lines between treatment conditions for each variant. Dotted lines indicate value of NT-sgRNA plus DMSO condition. (I) Heatmap of normalized expression level of pS6 (pS235/pS236), CTLA4, PD1, and TOX for CD3+ T cells engineered with selected GOF variants determined to be either Len-sensitive or Len-resistant or a control NT-sgRNA. For pS6, cells were stimulated for 20 min in the presence of DMSO or Len. For TOX, PD1, and CTLA4, cells were activated and expanded for 10 days in the presence of DMSO or Len. n = 3 biological replicates for each variant are shown as individual rows. (J) Position of Len-resistant PIK3R1 iSH2 domain GOF variants in (I) in the structure of PI3Kδ. All results were repeated in at least N = 3 healthy human donors. Related to Figure S7.
Figure 5.
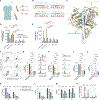
Figure 5.. Functional effects and Len sensitivity of engineered PIK3CD and PIK3R1 GOF variants are reflected in APDS patient samples
(A) Schematic for functional and phenotypic assessment of T cells from two APDS patients (APDS1: PIK3CD c.3,061G>A, p.E1,021K; and APDS2: PIK3R1 c.1692C>A, p.N564K). (B) Representative WebLogo visualizations of next-generation sequencing (NGS) of patient sample loci with heterozygous variants (shaded red) compared with a representative healthy donor (HD). (C) Position of patient variants in B (PIK3CD p.E1021K, brown; PIK3R1 p.N564K, blue) in the PI3Kδ protein complex relative to enriched (green) and depleted (red) variants in pAKT/pS6 screens. (D and E) (D) Percent pS6 (pS235/pS236) positive and (E) pAKT (pS473) MFI in T cells from APDS patients and 3 HDs. T cells were either unstimulated, stimulated for 20 min in the presence of DMSO vehicle control, or stimulated for 20 min in the presence of 100 nM Len. n = 3 biological replicates. (F) Representative contour plots from experiment in E for pAKT (pS473) and pS6 (pS235/pS236) in APDS and HD T cells stimulated for 20 min with DMSO vehicle control. (G–J) (G) CD69, (H) CTLA4, (I) TOX, and (J) TCF1 expression in APDS patient and HD T cells after 7 days of activation and expansion. n = 3 biological replicates. (K–N) (K) Relative expression of CTLA4, (L) PD1, (M) TOX, and (N) Relative T cell expansion, in the CD4 and CD8 compartments of APDS patient T cells activated and expanded in the presence of either DMSO or 100 nM Len for 7 days. n = 2–3 biological replicates. One-way ANOVA with Bonferroni’s test for multiple comparisons in (D)–(J) or two-way ANOVA with Tukey’s test for multiple comparisons in (K)–(N). Error bars represent mean ± standard deviation. Related to Figure S8.
Figure 6.
Figure 6.. Combinatorial drug targeting of PI3Kδ pathway proteins enhances patient sample responses
(A and B) (A) Relative expression of pS6 (pS235/pS236) and (B) CD71 in APDS patient T cells after stimulation for 24 h in the presence of either DMSO vehicle control or 100 nM Len. For each patient sample, expression of each marker is normalized to the mean of replicates in the DMSO condition. n = 3 biological replicates. (C) Representative schematic of combinatorial PI3K pathway targeting with drugs targeting p110δ (leniolisib), mTORC1 (rapamycin and everolimus), and mTORC2 (rapamycin). (D and E) (D) Expression of pS6 (pS235/pS236) in a patient sample with PIK3R1 p.N564K and (E) a patient sample with PIK3CD p.E1021K after 24 h of stimulation with either DMSO vehicle control or 100 nM of the indicated drug(s) (leniolisib, Len; rapamycin, Rap; and everolimus, Evr). n = 3 biological replicates. (F and G) Same as (D) and (E) but for CD71, with representative flow cytometry histograms shown. (H and I), Same as (D) and (E) but for TOX after 7 days of activation and expansion with the indicated drug treatment. n = 3 biological replicates. Representative flow cytometry histograms shown. One-way ANOVA with Tukey’s test for multiple comparisons in (A) and (B). One-way ANOVA with Bonferroni’s test for multiple comparisons in (D)–(I). Error bars represent mean ± standard deviation. Related to Figure S9.
Figure 7.
Figure 7.. Identification of screen-discovered GOF/LOF variants in clinical databases identifies potential cases of APDS and risk for immunopathology
(A) Integration of pAKT/pS6 screen data with PIK3CD and PIK3R1 VUS encountered in patients enrolled in a clinical IEI cohort with signs and symptoms suggestive of APDS. (B) Immuno-pathologies encountered in N = 27 patients from the IEI cohort described in (A) with either an exact variant match or different variant at the same amino acid as a GOF identified in the pAKT/pS6 screen (STAR Methods) (N = 7 and N = 20 patients, respectively). Related to Figure S9.

References

    1. von Hardenberg S, Klefenz I, Steinemann D, Di Donato N, Baumann U, Auber B, and Klemann C (2024). Current genetic diagnostics in inborn errors of immunity. Front. Pediatr 12, 1279112. 10.3389/fped.2024.1279112. - DOI - PMC - PubMed
    1. Al-Mousa H, Abouelhoda M, Monies DM, Al-Tassan N, Al-Ghonaium A, Al-Saud B, Al-Dhekri H, Arnaout R, Al-Muhsen S, Ades N, et al. (2016). Unbiased targeted next-generation sequencing molecular approach for primary immunodeficiency diseases. J. Allergy Clin. Immunol 137, 1780–1787. 10.1016/j.jaci.2015.12.1310. - DOI - PubMed
    1. Gallo V (2016). Diagnostics of primary immunodeficiencies through next generation sequencing. 10.26226/morressier.57bc1758d462b80290b4d256. - DOI - PMC - PubMed
    1. Meyts I, Bosch B, Bolze A, Boisson B, Itan Y, Belkadi A, Pedergnana V, Moens L, Picard C, Cobat A, et al. (2016). Exome and genome sequencing for inborn errors of immunity. J. Allergy Clin. Immunol 138, 957–969. 10.1016/j.jaci.2016.08.003. - DOI - PMC - PubMed
    1. Cifaldi C, Brigida I, Barzaghi F, Zoccolillo M, Ferradini V, Petricone D, Cicalese MP, Lazarevic D, Cittaro D, Omrani M, et al. (2019). Targeted NGS platforms for genetic screening and gene discovery in primary Immunodeficiencies. Front. Immunol 10, 316. 10.3389/fimmu.2019.00316. - DOI - PMC - PubMed

MeSH terms

Substances

Supplementary concepts

LinkOut - more resources