

Applying multimodal AI to physiological waveforms improves genetic prediction of cardiovascular traits
- PMID: 40543505
- PMCID: PMC12256885
- DOI: 10.1016/j.ajhg.2025.05.015
Applying multimodal AI to physiological waveforms improves genetic prediction of cardiovascular traits
Abstract
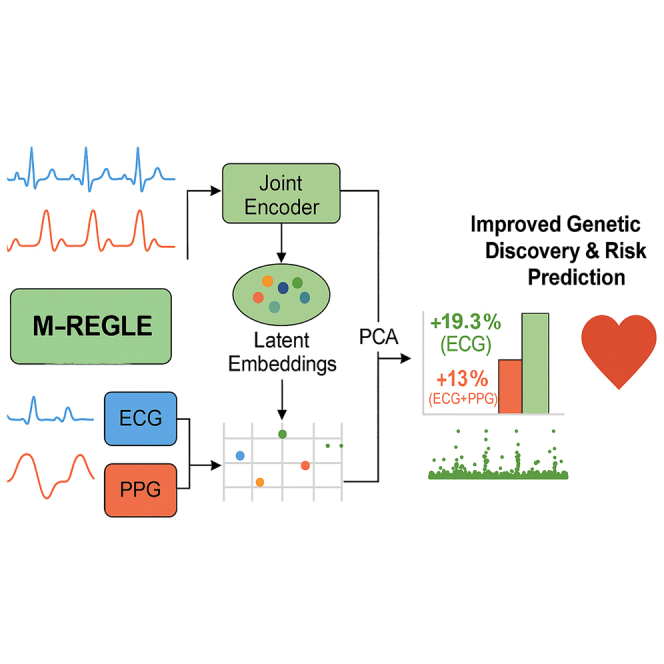
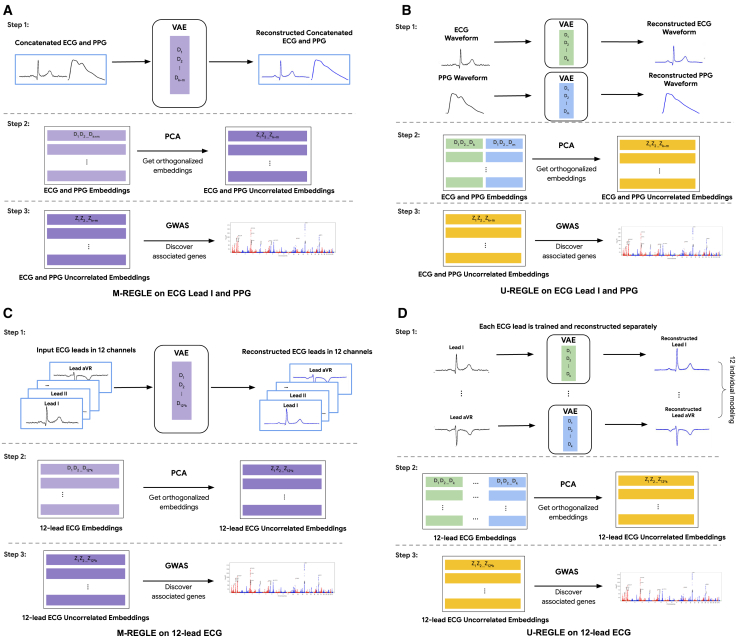
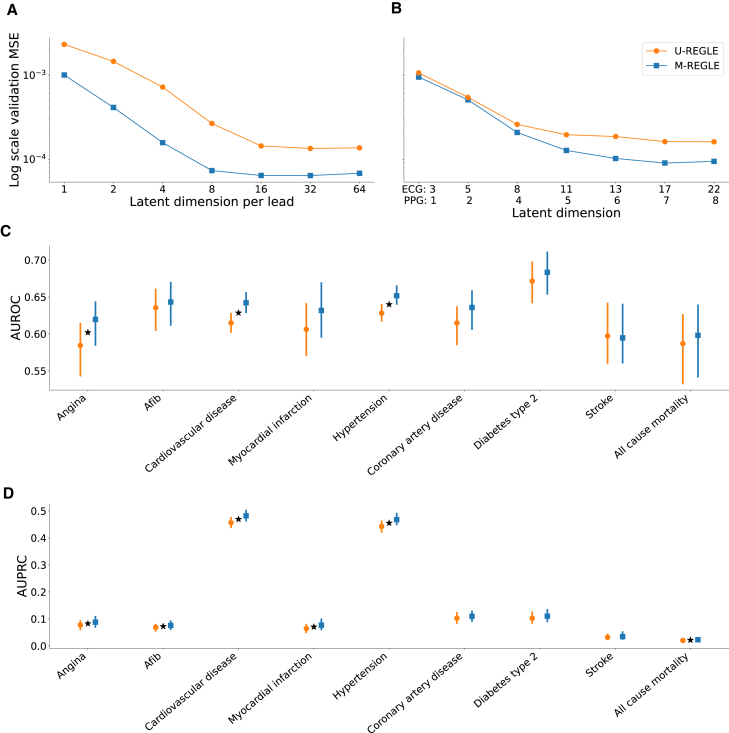
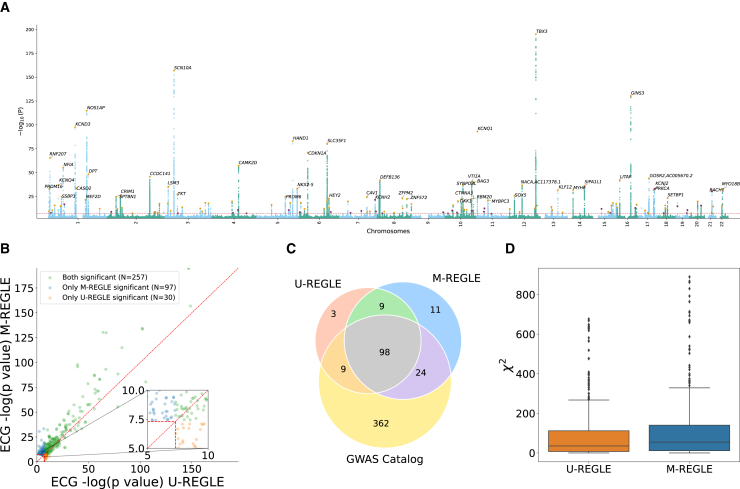
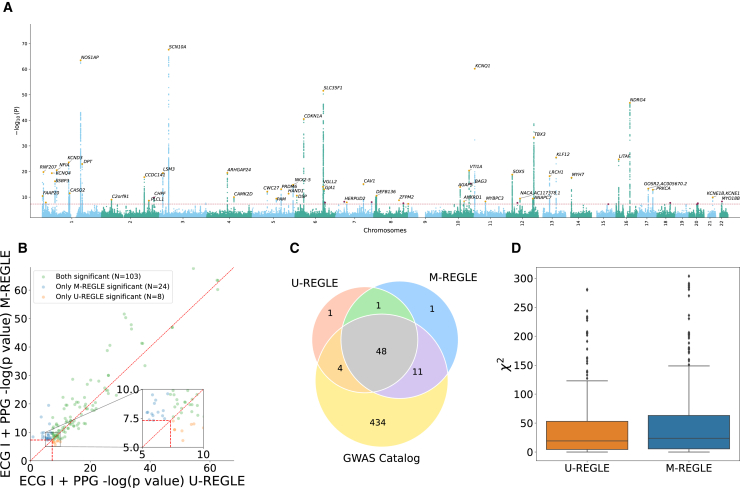
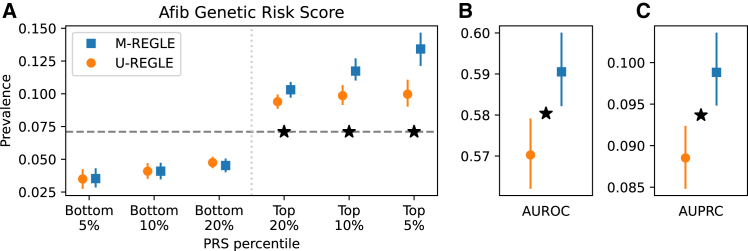
Electronic health records, biobanks, and wearable biosensors enable the collection of multiple health modalities from many individuals. Access to multimodal health data provides a unique opportunity for genetic studies of complex traits because different modalities relevant to a single physiological system (e.g., circulatory system) encode complementary and overlapping information. We propose a multimodal deep learning method, multimodal representation learning for genetic discovery on low-dimensional embeddings (M-REGLE), for discovering genetic associations from a joint representation of complementary electrophysiological waveform modalities. M-REGLE jointly learns a lower representation (i.e., latent factors) of multimodal physiological waveforms using a convolutional variational autoencoder, performs genome-wide association studies (GWASs) on each latent factor, then combines the results to study the genetics of the underlying system. To validate the advantages of M-REGLE and multimodal learning, we apply it to common cardiovascular modalities (photoplethysmogram [PPG] and electrocardiogram [ECG]) and compare its results to unimodal learning methods in which representations are learned from each data modality separately but are statistically combined for downstream genetic comparison. M-REGLE identifies 19.3% more loci on the 12-lead ECG dataset, 13.0% more loci on the ECG lead I + PPG dataset, and its genetic risk score significantly outperforms the unimodal risk score at predicting cardiac phenotypes, such as atrial fibrillation (Afib), in multiple biobanks.
Keywords: AI; GWAS; PRS; cardiovascular disease; deep learning; fusion model; multimodal; representation learning; variational autoencoder.
Copyright © 2025 The Author(s). Published by Elsevier Inc. All rights reserved.
Conflict of interest statement
Declaration of interests Y.Z., J.K., T.Y., H.Y., A.C., C.Y.M., B.B., and F.H. are current or former employees of Google, and own Alphabet Inc stocks. This study was funded by Google LLC. A.P.K. has acted as a paid consultant or lecturer to Abbvie, Aerie, Allergan, Google Health, Heidelberg Engineering, Novartis, Reichert, Santen, Thea, and Topcon. A.F.S. has received funding from New Amsterdam Pharma for an unrelated project.
Figures
Similar articles
-
Utilizing multimodal AI to improve genetic analyses of cardiovascular traits.medRxiv [Preprint]. 2024 Mar 20:2024.03.19.24304547. doi: 10.1101/2024.03.19.24304547. medRxiv. 2024. PMID: 38562791 Free PMC article. Preprint.
-
Influence of early through late fusion on pancreas segmentation from imperfectly registered multimodal magnetic resonance imaging.J Med Imaging (Bellingham). 2025 Mar;12(2):024008. doi: 10.1117/1.JMI.12.2.024008. Epub 2025 Apr 26. J Med Imaging (Bellingham). 2025. PMID: 40291815
-
Machine-learning detection of stress severity expressed on a continuous scale using acoustic, verbal, visual, and physiological data: lessons learned.Front Psychiatry. 2025 Jun 13;16:1548287. doi: 10.3389/fpsyt.2025.1548287. eCollection 2025. Front Psychiatry. 2025. PMID: 40585547 Free PMC article.
-
123I-MIBG scintigraphy and 18F-FDG-PET imaging for diagnosing neuroblastoma.Cochrane Database Syst Rev. 2015 Sep 29;2015(9):CD009263. doi: 10.1002/14651858.CD009263.pub2. Cochrane Database Syst Rev. 2015. PMID: 26417712 Free PMC article.
-
Multimodal interventions for cachexia management.Cochrane Database Syst Rev. 2025 Mar 25;3(3):CD015749. doi: 10.1002/14651858.CD015749.pub2. Cochrane Database Syst Rev. 2025. PMID: 40130780
References
-
- Jónsson B., Bjornsdottir G., Thorgeirsson T., Ellingsen L.M., Walters G.B., Gudbjartsson D.F., Stefansson H., Stefansson K., Ulfarsson M.O. Brain age prediction using deep learning uncovers associated sequence variants. Nat. Commun. 2019;10:5409. doi: 10.1038/s41467-019-13163-9. - DOI - PMC - PubMed
-
- Alipanahi B., Hormozdiari F., Behsaz B., Cosentino J., McCaw Z.R., Schorsch E., Sculley D., Dorfman E.H., Foster P.J., Peng L.H., et al. Large-scale machine-learning-based phenotyping significantly improves genomic discovery for optic nerve head morphology. Am. J. Hum. Genet. 2021;108:1217–1230. doi: 10.1016/j.ajhg.2021.05.004. - DOI - PMC - PubMed
-
- Aung N., Vargas J.D., Yang C., Fung K., Sanghvi M.M., Piechnik S.K., Neubauer S., Manichaikul A., Rotter J.I., Taylor K.D., et al. Genome-wide association analysis reveals insights into the genetic architecture of right ventricular structure and function. Nat. Genet. 2022;54:783–791. doi: 10.1038/s41588-022-01083-2. - DOI - PMC - PubMed
MeSH terms
LinkOut - more resources
Full Text Sources
