. 2025 Jul 15;6(7):102198.
doi: 10.1016/j.xcrm.2025.102198. Epub 2025 Jun 20.

Immune targeting of triple-negative breast cancer through a clinically actionable STING agonist-CAR T cell platform

Affiliations

Immune targeting of triple-negative breast cancer through a clinically actionable STING agonist-CAR T cell platform

Yuqing Zhang et al. Cell Rep Med. .

Abstract

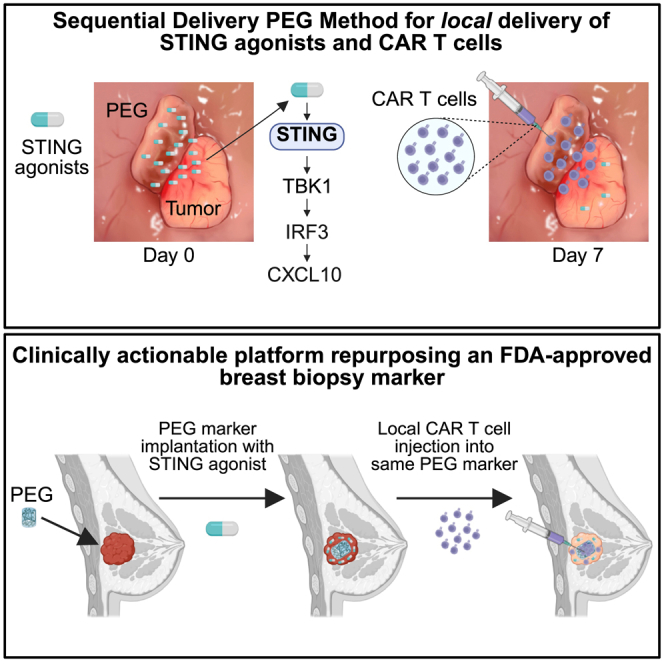
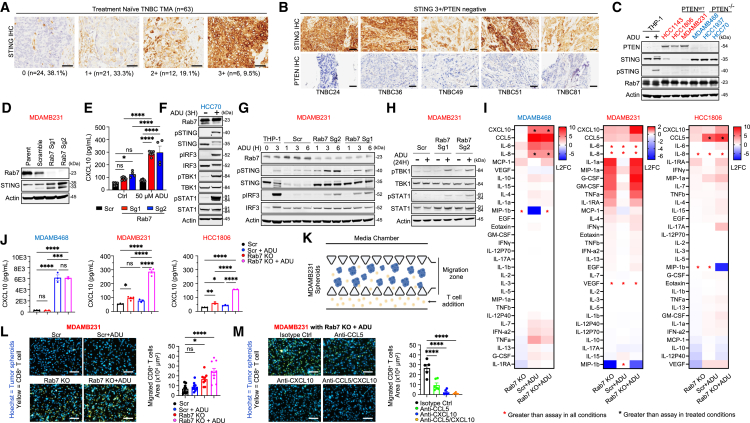
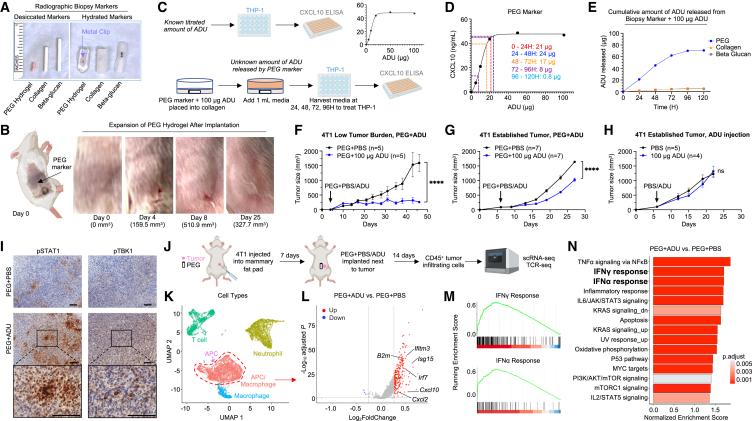
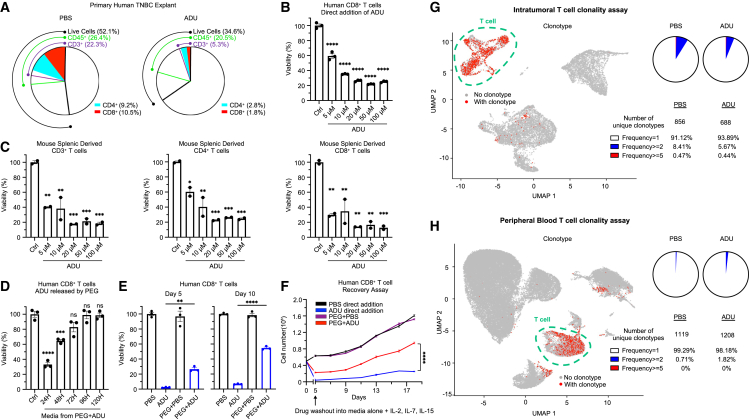
Stimulator of interferon genes (STING) has emerged as a critical cancer immunotherapy target. However, no STING agonist has advanced beyond phase I/II clinical trials, as obstacles center around applying STING agonism to the appropriate clinical context, retaining it in the tumor microenvironment (TME), and limiting its T cell toxicity. Using triple-negative breast cancer (TNBC), we identify defective STING turnover as a cancer state promoting hypersensitivity to STING agonism. We also repurpose a US Food and Drug Administration (FDA)-approved polyethylene glycol (PEG) biopsy marker to deliver STING agonists in a controlled release fashion into the TME. However, STING agonist-induced T cell toxicity limits robust endogenous clonal T cell response, which can be overcome by sequential co-delivery of the STING agonists with CAR T cell therapy using the same PEG marker, eradicating orthotopic TNBC in mouse models while also controlling distant disease. These findings identify a highly translatable platform to combine STING agonists with CAR T cell therapy locally for TNBC and potentially other solid cancers.

Keywords: CAR t cells; PEG marker; STING agonist; triple-negative breast cancer.


Conflict of interest statement

Declaration of interests DFCI/BWH have filed patents related to this work (inventors: T.U.B. and D.A.B.). T.U.B. consults for QIAGEN and has ownership interest in patents using STING levels as a biomarker for cancer immunotherapy and microfluidic cell culture of patient-derived tumor cell spheroids. D.A.B. is a consultant/advisory board member at QIAGEN and NMS and has ownership interest in STING biomarker and microfluidic culture patents and in Xsphera Biosciences.

Figures

None
Graphical abstract
Figure 1
Figure 1
Sustained tumor cell STING signaling promotes T cell migration (A) Representative IHC images of STING staining of a TMA (n = 63). 0 = no tumor cell staining; 1+ = faint, 2+ = moderate, 3+ = strong staining in >10% of tumor cells. Scale bar, 50 μm. (B) Tumor cell STING staining in PTEN-null TNBCs. Scale bar, 50 μm. (C) Immunoblot of STING and other proteins across TNBC lines, including ADU-S100 (ADU; 50 μM, 3 h)-treated THP-1 monocytes to distinguish phosphorylated STING (pSTING). (D) Immunoblot of MDAMB231 parental cells, cells expressing scramble (Scr), or Rab7 knockout (KO) vectors (Sg1 and Sg2). (E) CXCL10 ELISA from conditioned medium (CM) of the indicated Scr or Rab7 KO cells treated with ADU at 50 μM for 48 h (n = 4–8) or PBS control (ctrl). (F) Immunoblot of PTEN-null HCC70 cells treated with ADU at 50 μM for 3 h. (G) Immunoblot of MDAMB231 Scr or Rab7 KO cells treated with 50 μM ADU at the indicated time points. (H) Immunoblot of MDAMB231 Scr or Rab7 KO cells treated with 50 μM ADU for 24 h. (I) Heatmap showing log2 fold change (L2FC) of a cytokine/chemokine panel, normalized to untreated Scr cells (n = 2–4). Red asterisk indicates values above assay in all conditions, black asterisk indicates above assay in treated conditions, using the upper limit for L2FC calculation. (J) CXCL10 ELISA in CM from the indicated cell lines with or without 50 μM ADU treatment at 48 h (n = 2–4). (K) T cell migration assay schematic. (L) Representative images of CD8+ T cells (yellow) migrating toward MDAMB231 spheroids (Hoechst). Migrated CD8+ T cells were quantified after 48 h (n = 9). Scale bar, 100 μm. (M) Representative images of CD8+ T cells (yellow) migrating toward Rab7 KO MDAMB231 spheroids (Hoechst). Migrated CD8+ T cells were quantified after 48 h (n = 5–6). Scale bar, 100 μm. Quantitative data are represented as mean ± SEM. p values were calculated by one-way (J, L, and M) and two-way (E) ANOVA followed by Tukey’s post hoc test. ns, not significant. ∗p < 0.05, ∗∗p < 0.01, ∗∗∗p < 0.001, ∗∗∗∗p < 0.0001.
Figure 2
Figure 2
PEG marker-mediated delivery of STING agonism into the TME of TNBC (A) Image of desiccated vs. 2 h hydrated radiographic biopsy markers. The metal clip is denoted by a blue arrow. (B) Implantation of a PEG marker (PEG) in the right flank of an NOD SCID gamma (NSG) mouse with magnification of the PEG marker on days 0, 4, 8, and 25. (C) Schematic of the assay used to determine PEG-ADU release. (D) Standard curve from (C), generated with averaged values of 4 replicates, to determine the amount of ADU released from the PEG at each 24-h interval. (E) Cumulative amount of ADU released from various biopsy markers soaked with 100 μg ADU over time. Averaged values of triplicates or duplicates are shown. (F) 4T1 cells (10,000) were inoculated into the mammary fat pad of BALB/cJ mice, and 4 days later, PEG soaked with PBS or 100 μg ADU was implanted. Mean tumor volume measurements are shown (n = 5 mice/group). (G) 4T1 cells (100,000) were inoculated into the mammary fat pad. At a tumor size of 75 mm3 on day 6, mice were implanted with PEG soaked with PBS or 100 μg ADU. Mean tumor volume measurements are shown (n = 7 mice/group). (H) 4T1 tumors were established as in (G). On day 6, PBS or 100 μg ADU was injected intratumorally. Mean tumor volume measurements are shown (n = 4–5 mice/group). (I) Representative IHC images of pSTAT1 and pTBK1 staining of 4T1 tumors treated with PEG+PBS or PEG+100 μg ADU for 4 days. Scale bar, 100 μm. (J) Schematic of 4T1 orthotopic tumor establishment followed by day 7 PEG+PBS or PEG+ADU treatment. scRNA-seq/TCR-seq was performed from 4 pooled tumors/group 14 days later. (K) Uniform manifold approximation and projection (UMAP) unsupervised clustering of CD45+ cell scRNA-seq data from (J). (L) Volcano plot of differentially expressed genes in the APC/macrophage cluster. (M and N) Gene set enrichment analysis plots for IFNγ and IFNα response (M) and Hallmark gene set enrichment (N) in the APC/macrophage cluster. Quantitative data are represented as mean ± SEM. p values were calculated by two-way ANOVA followed by Sidak’s post hoc test (F–H). ∗∗∗∗p < 0.0001.
Figure 3
Figure 3
Toxicity of STING agonism to endogenous T cells mitigated by PEG marker delivery (A) Flow cytometry of CD45+, CD3+, CD4+, and CD8+ T cells from a primary human TNBC explant treated with 50 μM ADU or PBS for 24 h. (B) Human CD8+ T cells isolated from PBMCs were treated with ADU for 24 h and analyzed by CellTiter-Glo assay (n = 3). (C) Splenocytes from C57BL/6J mice were treated with ADU for 24 h. Viability of T cells was analyzed by Zombie NIR flow cytometry (n = 2). (D) Human CD8+ T cells treated with CM for 24 h were collected at various time points from PEG+ADU as in Figure 2C and analyzed by CTG assay (n = 3). (E) Human CD8+ T cells treated with PBS controls or direct addition of 100 μg ADU versus PEG+100 μg ADU for 5 days and analyzed by CTG assay or then expanded in IL-2, IL-7, and IL-15, followed by CTG assay on day 10 (n = 3). (F) Human CD8+ T cells were treated with PBS controls or with direct addition of 100 μg ADU versus PEG+100 μg ADU for 5 days; expanded in IL-2, IL-7, and IL-15; and counted every 2–3 days (n = 3). (G) UMAP plot of TCR clonotype positivity from Figure 2J (left). Pie charts show the percentage of cells with unique TCR clonotypes of frequency 1, ≥2, and ≥5 for PEG+PBS and PEG+ADU treatment (right). (H) UMAP plot of TCR clonotype positivity of PBMCs from PEG+PBS- and PEG+ADU-treated 4T1 mice (left). Pie charts show the percentage of cells with unique TCR clonotypes in PBMCs (right). Quantitative data are represented as mean ± SEM; p values were calculated by one-way ANOVA (B–E) or two-way ANOVA (F), followed by Tukey’s post hoc test. ∗p < 0.05, ∗∗p < 0.01, ∗∗∗p < 0.001, ∗∗∗∗p < 0.0001.
Figure 4
Figure 4
TNBC tumor cell STING signaling primes response to CAR T cell therapy (A) Immunoblot of mesothelin (MSLN) in PTEN WT (HCC1143, HCC1806, and MDAMB231) and PTEN-null (MDAMB468, HCC1937, and HCC70) TNBC cell lines. (B) Flow cytometry of MSLN expression in HCC1806 and HCC70 using HCC1143 as a control (representative of 2 independent experiments). (C) Schematic of CAR constructs with retroviral and lentiviral vectors. SP, signal peptide; ScFv, single-chain variable fragment; EC, extracellular; TM, transmembrane. (D and E) Cell lines were co-cultured in 2D with CD19 or MSLN CAR T cells for 24 h at indicated effector:target (E:T) ratios and assessed by CTG assay (n = 3). Data are representative of three independent experiments. (F and G) Representative images of HCC1806 and HCC70 co-cultured as 3D spheroids with CD19 or MSLN CAR T cells in a microfluidics device for 72 h. E:T ratio of 1:1. Staining as indicated for live and dead cells. Scale bar, 100 μm. (H) Quantification of 3D tumor spheroid cell death using DRAQ7/Hoechst staining (n = 2–6). Ctrl indicates tumor cells only. (I) CM from 3D co-culture was analyzed for IFNγ, granzyme B, and TNF-α by ELISA (n = 2–6). (J) Representative images of MSLN CAR T cell migration with untreated HCC70 and HCC1806 spheroids utilizing the 3D microfluidics device. MSLN CAR T cells fully migrate toward HCC70 (PTEN null) by 48 h, in contrast to HCC1806 cells (PTEN WT), denoted by a black arrow. E:T ratio of 1:1. Live and dead cells were stained as indicated. Scale bar, 100 μm. Quantification of migrated CAR T cells and percent tumor cell death are shown (n = 5–6). (K) Representative images of MSLN CAR T cell migration with HCC1806 Scr and Rab7 KO spheroids utilizing the 3D microfluidic device after 48 h. E:T ratio of 1:1. Scale bar, 100 μm. Spheroids were pretreated with 50 μM ADU or ctrl (PBS) for 24 h before loading. Quantification of migrated CAR T cells and percent tumor cell death are shown (n = 4–7). CM was analyzed for IFNγ and granzyme B by ELISA (n = 3–5). Quantitative data are represented as mean ± SEM. p values were calculated by two-way ANOVA followed by Sidak’s post hoc test (D and E), one-way (K) and two-way (H and I) ANOVA followed by Tukey’s post hoc test, and unpaired Student’s t test (J). ∗p < 0.05, ∗∗p < 0.01, ∗∗∗p < 0.001, ∗∗∗∗p < 0.0001.
Figure 5
Figure 5
PEG biopsy marker-mediated local delivery of CAR T cells to target TNBC (A) Bioluminescent imaging of a PEG marker soaked with PBS or NanoLuc-MSLN CAR T cells. (B) Bioluminescent imaging of a hydrated PEG marker injected with PBS or NanoLuc-MSLN CAR T cells. (C) Schematic of MSLN CAR T cells soaked into various biopsy markers and then co-cultured with firefly luciferase expressing HCC70 spheroids (ffLUC-HCC70). (D and E) ffLUC-HCC70 spheroids co-cultured with PEG markers soaked (D) or injected (E) with B-cell maturation antigen (BCMA) or MSLN CAR T cells at the indicated E:T ratios. Tumor cell death was determined by luciferase assay at 24 h (n = 3–4). (F and G) Orthotopically established HCC70 tumors were implanted with PEG soaked with PBS or 4 × 10⁶ MSLN CAR T cells. CD3 IHC was performed on day 14 (F) and day 42 (G). Scale bar, 100 μm. (H) HCC70 tumor with an adjacent PEG. Dissection shows an intact PEG marker with a visible metal clip. (I) Orthotopically established HCC70 tumors were implanted with PEG+PBS or PEG+100 μg ADU, and 7 days later, PEG markers were extracted and cocultured with MSLN CAR T cells. (J) Quantification of MSLN CAR T cell viability from (I) using CTG (n = 2–3). (K) Schematic of the sequential delivery PEG (sd-PEG) method. Established tumors are implanted with PEG+PBS or PEG+ADU, followed 7 days later by CAR T cell injection into the PEG. (L) Representative IHC images of human CD3 staining on day 2 using the sd-PEG method with 50,000 MSLN CAR T cells (left). Scale bar, 100 μm. Quantification of CD3+ cells per high-power field is shown (right) (n = 4–5 mice/group). (M and N) Digested tumors were also analyzed for human CD3 by flow cytometry on day 2. Quantification of CD3+ cells is shown (n = 5 mice/group). Quantitative data are represented as mean ± SEM. p values were calculated by two-way ANOVA followed by Sidak’s post hoc test (D and E), one-way ANOVA followed by Tukey’s post hoc test (J), and unpaired Student’s t test (L and N). ∗p < 0.05, ∗∗∗p < 0.001, ∗∗∗∗p < 0.0001.
Figure 6
Figure 6
PEG biopsy marker-mediated local delivery of STING agonism and CAR T cells results in long-term durable control of TNBC growth (A) Orthotopically established HCC70 (non-labeled) tumors were treated with ADU+NanoLuc-labeled CAR T cells (4 × 10⁶) via direct intratumoral injection, dual PEG delivery (PEG+ADU and PEG+CAR T), or the sd-PEG method (n = 3–4 mice/group). Bioluminescent distribution of CAR T cells at the indicated time points is shown. (B) Total flux of bioluminescent signals from ADU+MSLN CAR T cell groups from (A) was quantified at the indicated time points. (C) Orthotopically established HCC70 tumors were implanted with PEG+PBS or PEG+ADU on day −7. On day 0, the indicated doses of NanoLuc-CD19/MSLN CAR T cells were injected into the PEG. MSLN2 = 2 × 10⁶ MSLN CAR T cells; MSLN1 = 1 × 10⁶ MSLN CAR T cells; MSLN0.5 = 0.5 × 10⁶ MSLN CAR T cells. Mean tumor volume measurements are shown (n = 3–4 mice/group). (D) Intratumoral CAR T cell expansion over time from (C). (E) Orthotopically established HCC70 tumors were treated via the sd-PEG method using 2 × 10⁶ or 4 × 10⁶ MSLN CAR T cells (MSLN2 or MSLN4) or 4 × 10⁶ CD19 CAR T cells. Intratumoral CAR T cell expansion was monitored over 12 weeks (F) Quantification of tumor volume for each treatment group from (E) (n = 5 mice/group). (G) Kaplan-Meier RFS curves (n = 5 mice/group). Relapse was defined by tumor regrowth >500 mm3. (H) Circulating human IFNγ levels on days 7, 14, and 21 (n = 5 mice/group). (I) Representative IHC images of MSLN staining of a PBS+CD19 control tumor versus three different relapsed tumors from the PBS+MSLN2 group from (F). Scale bar, 100 μm. Quantitative data are represented as mean ± SEM. p values were calculated by two-way ANOVA followed by Tukey’s post hoc test (C), Sidak’s post hoc test (F), and log rank Mantel-Cox test (G). ∗p < 0.05, ∗∗p < 0.01, ∗∗∗∗p < 0.0001.
Figure 7
Figure 7
STING agonist followed by CAR T cell delivery via the sd-PEG method results in effective control of distant TNBC growth (A) Increase in circulating human CD3+ T cells after ADU priming (n = 5 mice/group). (B) Schematic of the dual tumor model. (C and D) Tumors were established orthotopically and in the ipsilateral flank, followed by 2 × 10⁶ or 4 × 10⁶ MSLN CAR T cell or control CD19 CAR T cell treatment with or without ADU as per the sd-PEG method. Mean tumor volume measurements of primary and flank tumors are shown (n = 3–4 mice/group). (E) Intratumoral CAR T cell expansion at the primary and flank tumor sites. (F and G) Kaplan-Meier survival curves from both experiments (n = 7–8 mice/group). (H) Schematic of the metastasis prevention model. (I) Tumors were established orthotopically and treated with 2 × 10⁶ MSLN CAR T cells or control CD19 CAR T cells via the sd-PEG method; 7 days later, HCC70 cells were injected into the ipsilateral flank. Mean tumor volume measurements of primary and flank tumors are shown (n = 4 mice/group). (J) Kaplan-Meier survival curves (n = 4 mice/group). Quantitative data are represented as mean ± SEM. p values were calculated by two-way ANOVA followed by Tukey’s post hoc test (C and D) or Sidak’s post hoc test (I) and log rank Mantel-Cox test (F, G, and J). ∗p < 0.05, ∗∗p < 0.01, ∗∗∗p < 0.001, ∗∗∗∗p < 0.0001.

Similar articles

References

    1. Zagami P., Carey L.A. Triple negative breast cancer: Pitfalls and progress. NPJ Breast Cancer. 2022;8:95. doi: 10.1038/s41523-022-00468-0. - DOI - PMC - PubMed
    1. Lehmann B.D., Bauer J.A., Chen X., Sanders M.E., Chakravarthy A.B., Shyr Y., Pietenpol J.A. Identification of human triple-negative breast cancer subtypes and preclinical models for selection of targeted therapies. J. Clin. Investig. 2011;121:2750–2767. doi: 10.1172/JCI45014. - DOI - PMC - PubMed
    1. Cancer Genome Atlas Network Comprehensive molecular portraits of human breast tumours. Nature. 2012;490:61–70. doi: 10.1038/nature11412. - DOI - PMC - PubMed
    1. Burstein M.D., Tsimelzon A., Poage G.M., Covington K.R., Contreras A., Fuqua S.A.W., Savage M.I., Osborne C.K., Hilsenbeck S.G., Chang J.C., et al. Comprehensive genomic analysis identifies novel subtypes and targets of triple-negative breast cancer. Clin. Cancer Res. 2015;21:1688–1698. doi: 10.1158/1078-0432.CCR-14-0432. - DOI - PMC - PubMed
    1. Cortes J., Cescon D.W., Rugo H.S., Nowecki Z., Im S.A., Yusof M.M., Gallardo C., Lipatov O., Barrios C.H., Holgado E., et al. Pembrolizumab plus chemotherapy versus placebo plus chemotherapy for previously untreated locally recurrent inoperable or metastatic triple-negative breast cancer (KEYNOTE-355): a randomised, placebo-controlled, double-blind, phase 3 clinical trial. Lancet. 2020;396:1817–1828. doi: 10.1016/S0140-6736(20)32531-9. - DOI - PubMed

MeSH terms