. 2025 Jun 21;10(1):196.
doi: 10.1038/s41392-025-02300-0.

TSC22 domain family member 3 links natural killer cells to CD8+ T cell-mediated drug hypersensitivity

Affiliations

TSC22 domain family member 3 links natural killer cells to CD8+ T cell-mediated drug hypersensitivity

Lele Sun et al. Signal Transduct Target Ther. .

Abstract

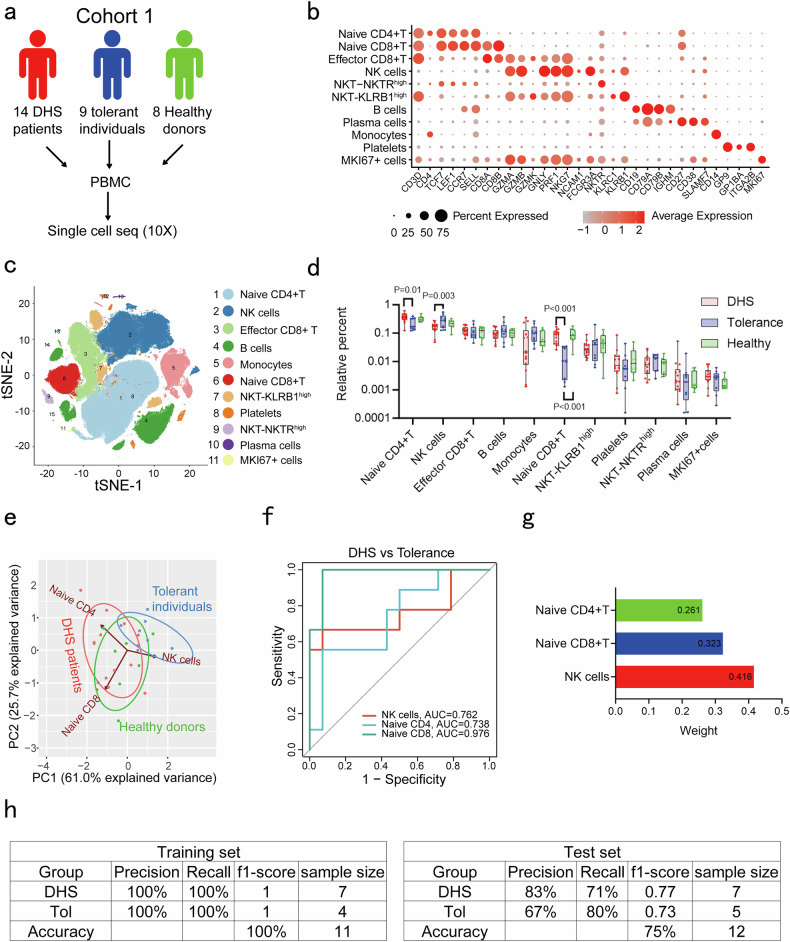
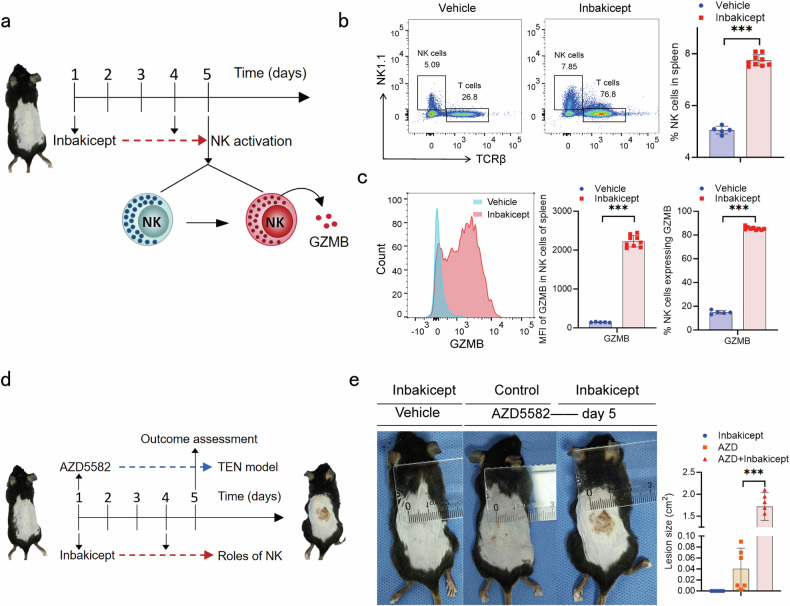
Severe cutaneous adverse drug reactions (SCARs) are life-threatening diseases, which are associated with human leukocyte antigen (HLA) risk variants. However, the low positive predictive values of HLA variants suggest additional factors influence disease susceptibility. Using dapsone hypersensitivity syndrome (DHS) as a paradigm for SCARs, we show that the DHS patients harbor a sex-related global reduction in blood NK cells, contributing to the higher incidence of reactions in females. Single-cell RNA sequencing revealed a decrease in the immunoregulatory CD56low XCL1/2low NK cell subset and an expansion of CD56high XCL1/2high NK cell subsets with an effector phenotype in DHS patients compared to dapsone-tolerant individuals. Functionally, interleukin-15 superagonist-induced activation of NK cells exacerbated SCARs-like symptoms in a murine model. Mechanistically, TSC22 domain family member 3 (TSC22D3) deficiency enhanced NK cell effector function, shifting the immune response from CD4+ T cell to CD8+ T cell function. These results demonstrate that TSC22D3-regulated NK cells play a critical role in predisposing to drug hypersensitivity reactions, bridging innate and adaptive immune dysregulation in SCARs pathogenesis. Our study highlights the importance of NK cell heterogeneity and TSC22D3 in immune-mediated hypersensitivity disorders, offering potential therapeutic targets for SCARs and related conditions.


Conflict of interest statement

Competing interests: The authors declare no competing interests.

Figures

Fig. 1
Fig. 1
Different composition of immune cells between DHS patients and dapsone tolerant individuals. a Flow chart of scRNA-seq in cohort 1. PBMC of 14 DHS patients, nine dapsone-tolerant individuals and eight healthy donors were subject to scRNA-seq (without stimulation). b 11 distinct clusters representing different cell types in PBMC were identified based on the expression of cluster-specific markers and canonical signature genes such as CD3D, CD4, CD8A, CD14, CD19 and CD56 (NCAM1). c t-SNE plot displaying 11 identified distinct cellular clusters. d Relative abundances of each cluster in DHS patients, dapsone-tolerant individuals and healthy donors. One-way ANOVA followed by LSD was used for statistical analysis. e Principal component analyses (PCA) were performed using naive CD4+ T, naive CD8+ T and NK cells. The first and second principal components indicated the percentage of the variance. Each point represents one sample. f A receiver operating characteristic (ROC) curve showed the area under the curve (AUC), sensitivity and specificity of naive CD4+ T, naive CD8+ T and NK cells in distinguishing DHS patients from dapsone-tolerant individuals. g RF model showing the variable importance (weight) of naive CD4+ T, naive CD8+ T and NK cells in distinguishing DHS patients from dapsone-tolerant individuals. h RF model showing the accuracy in the training set and testing set, respectively
Fig. 2
Fig. 2
Higher incidence of DHS in female was associated with the lower NK cells. a Correlation analysis between percentage of each cluster in total PBMC and the onset time of DHS (from taking dapsone to onset). b Comparison of percentage of each cluster in total PBMC between male and female was performed in DHS patients. c, d The onset time of DHS between male and female was compared in discovery sets from cohort 1 (n = 14) (c) and separate replication sets (n = 61) (d). e, f Correlation analysis between age of taking dapsone and the onset time of DHS was performed in discovery sets from cohort 1 (n = 14) (e) and separate replication sets (n = 61) (f). g Meta-analysis enrolled a total of 533,680 patients taking drugs (307,736 were male and 225,944 were female) from seven studies was performed to validate the common sex difference in development of ADRs. The unpaired two-sided student’s t-test was used for statistical analysis
Fig. 3
Fig. 3
The dapsone dependent response in NK cells was greater in DHS patients than dapsone tolerant individuals. PBMC from 14 DHS patients and nine dapsone tolerant individuals were cultured with medium or dapsone (100 µM) for six days, and the percentage of activated NK cells that expressed GZMB (a) and GNLY (b) and the frequency of NK cells in total lymphocytes (c) were analyzed by flow cytometry. ROC curve showed the AUC, sensitivity and specificity of GZMB response (d), GNLY response (e) and frequency change of NK cells in lymphocytes (f) in distinguishing DHS patients from dapsone-tolerant individuals. The paired two-sided student’s t-test was used for statistical analysis (**P < 0.01 and ***P < 0.001)
Fig. 4
Fig. 4
NK cell subsets exhibit immune effector and immunosuppressive phenotypes. a Sub-clustering analysis for NK cells from cohort 1. t-SNE plot showed the main four NK cell subsets, including CD56low LAG3high, CD56low FCER1Ghigh, CD56low MTRNR2L12high and CD56high XCL1/2high NK cell subsets. b Bubble diagram indicated the expression of cluster-specific markers. c Relative abundances of each NK cluster in DHS patients, dapsone-tolerant individuals and healthy donors. One-way ANOVA followed by LSD was used for statistical analysis. d Correlation analysis between percentage of each NK cluster in total PBMC and the onset time of DHS. e The Venn diagram revealed the sharing and specific DEGs comparing between DHS patients and dapsone-tolerant individuals in CD56low LAG3high, CD56low FCER1Ghigh, CD56low MTRNR2L12high and CD56high XCL1/2high NK cell subsets. f The fold change value of the shared genes in the other three CD56low XCL1/2low NK cell subsets between DHS patients and dapsone-tolerant individuals. g Flow chart of scRNA-seq in cohort 2. PBMC of five DHS patients and five dapsone-tolerant individuals were stimulated with or without dapsone (100 µM) for four days and subject to scRNA-seq. h, i 15 distinct clusters representing different cell types in PBMC were identified based on the expression of cluster-specific markers and canonical signature genes such as CD3D, CD4, CD8A, CD14, CD19 and CD56 (NCAM1). j, k Relative abundances of each cluster was compared between stimulated with or without dapsone in DHS patients (j) and dapsone-tolerant individuals (k), respectively. The paired two-sided student’s t-test was used for statistical analysis (*P < 0.05). l The absolute elevation of frequency of CD56high XCL1/2high NK cells subsets in total PBMC after dapsone stimulation in DHS patients and dapsone-tolerant individuals. The unpaired two-sided student’s t-test was used for statistical analysis. m–p Volcano plot revealed distinct transcriptional profiles in CD56high XCL1/2high and CD56low XCL1/2low NK cells subsets between stimulating with or without dapsone in DHS patients and dapsone-tolerant individuals. Blue dotted frame, cohort 1; Red dotted frame, cohort 2
Fig. 5
Fig. 5
Effector NK cells aggravated the SCARs like symptoms in established mice model of SCARs. a C57BL/6 mice were injected intraperitoneally with 100 μl of 0.2 mg/ml inbakicept (IL-15 superagonist) on day one and day four to induce effector NK cells activation. b, c On day five, mice were euthanized and splenic cells were collected. The frequency of NK cells in total splenic cells (b) and the percentage and median fluorescence intensity (MFI) (c) of NK cells that expressed GZMB were analyzed by flow cytometry. d C57BL/6 mice were injected subcutaneously with 100 μl of 1 mg/ml AZD5582 on day one and injected intraperitoneally with 100 μl of 0.2 mg/ml inbakicept (IL-15 superagonist) on day one and day four. e On day five, mice were euthanized and the sites were photographed and scored. The unpaired two-sided student’s t-test was used for statistical analysis (***P < 0.001)
Fig. 6
Fig. 6
TSC22D3 governed NK cell phenotype. a The Venn diagram revealed the sharing DEGs between groups of DHS patients compared with dapsone-tolerant individuals and DHS patients compared with healthy donors, but not in group of dapsone-tolerant individuals compared with healthy donors in each NK cell subset. b The top 40 DEGs in each NK cell subset between DHS patients and dapsone-tolerant individuals from cohort 1. c The expression of GILZ (TSC22D3 encoded protein) was detected by flow cytometry in TSC22D3 knockout and wild-type (WT) NK cell lines (NK-92MI). d Bright-field microscopy images showed the morphology of TSC22D3 knockout and wild-type (WT) NK cell lines. e Cell growth curves of TSC22D3 knockout and WT NK-92MI. f Cell death was detected using propidine iodide (PI) by flow cytometry in TSC22D3 knockout and WT NK-92MI. g 3 × 10^3 TSC22D3 knockout or WT NK 92MI were plated in 96 well ELISPOT plate and cultured for one day. The release of IFN-γ, perforin and GZMB was detected by ELISPOT assay. The unpaired two-sided student’s t-test was used for statistical analysis (*P < 0.05,**P < 0.01 and ***P < 0.001)
Fig. 7
Fig. 7
NK cells with TSC22D3 deficiency enhanced CD8+ T cell response through both cytokines secretion and cell-cell-contact mechanisms. a Co-culture or trans-well assays were performed using 4 × 10^5 TSC22D3 knockout or WT NK 92MI and 1 × 10^6 T cells from DHS patients in 24 well plate for three days. The ratio of CD8+ T/CD4+ T cells were calculated. One-way ANOVA followed by LSD was used for statistical analysis (***P < 0.001). b The frequency of CD8+ T cells in T cells from Fig. 5a were analyzed by flow cytometry. The unpaired two-sided student’s t-test was used for statistical analysis (***P < 0.001). c, d The ratio of total CD8+ T/CD4+ T cells (c) and naive CD8+ T/CCR7high naive CD4+ T cells (d) from cohort 2 were calculated. e-f ROC curve showed the AUC, sensitivity and specificity of the ratio change of total CD8+ T/CD4+ T cells (e) and naive CD8+ T/CCR7high naive CD4+ T cells (f) after dapsone stimulation in distinguishing DHS patients from dapsone-tolerant individuals. The paired two-sided student’s t-test was used for statistical analysis (*P < 0.05 and **P < 0.01). g, h The MFI of GZMB (g) and GNLY (h) in CD8+ T cells from a were analyzed by flow cytometry. One-way ANOVA followed by LSD was used for statistical analysis (***P < 0.001). i The percentage of CD8+ T cells that expressed GZMB from Fig. 5a were analyzed by flow cytometry. The unpaired two-sided student’s t-test was used for statistical analysis (***P < 0.001)

References

    1. Cadot, R. et al. Exploring recent advances in drugs severe cutaneous adverse reactions immunopathology. Allergy80, 47–62 (2025). - PMC - PubMed
    1. Kroshinsky, D., Cardones, A. R. G. & Blumenthal, K. G. Drug Reaction with Eosinophilia and Systemic Symptoms. N. Engl. J. Med. 391, 2242–2254 (2024). - PubMed
    1. Parisi, R. et al. Acute Generalized Exanthematous Pustulosis: Clinical Features, Differential Diagnosis, and Management. Am. J. Clin. Dermatol24, 557–575 (2023). - PMC - PubMed
    1. Pavlos, R. et al. T cell-mediated hypersensitivity reactions to drugs. Annu Rev. Med. 66, 439–454 (2015). - PMC - PubMed
    1. Saag, M. et al. High sensitivity of human leukocyte antigen-b*5701 as a marker for immunologically confirmed abacavir hypersensitivity in white and black patients. Clin. Infect. Dis.46, 1111–1118 (2008). - PubMed