. 2025 Jun 21;10(1):128.
doi: 10.1038/s41541-025-01159-0.

Modeling gonorrhea vaccination to find optimal targeting strategies that balance impact with cost-effectiveness

Affiliations

Modeling gonorrhea vaccination to find optimal targeting strategies that balance impact with cost-effectiveness

Trystan Leng et al. NPJ Vaccines. .

Abstract

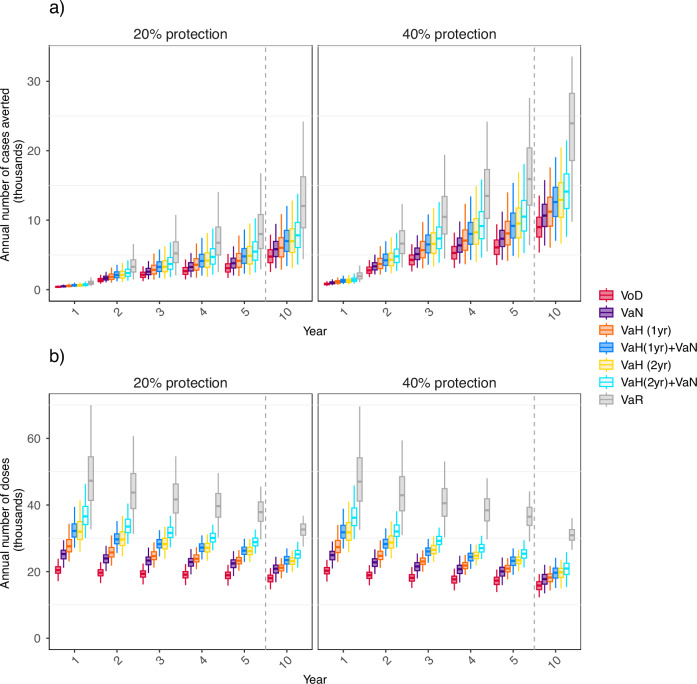
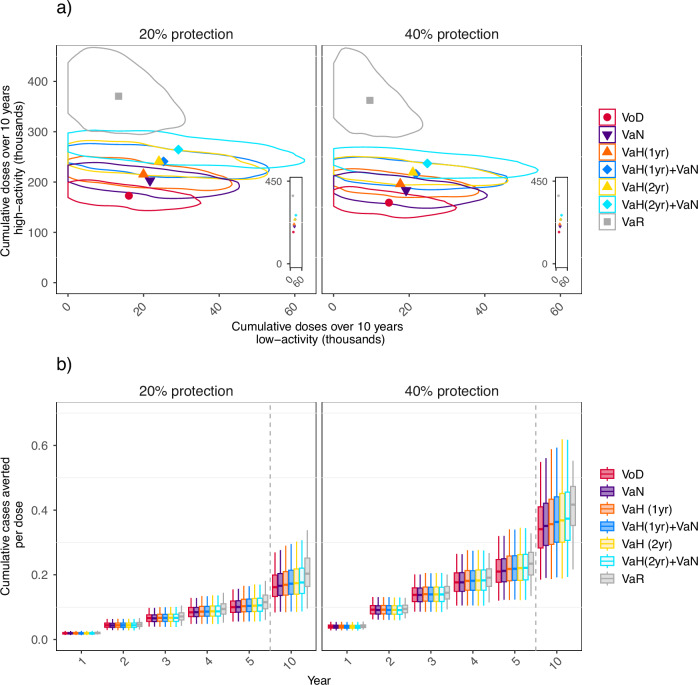
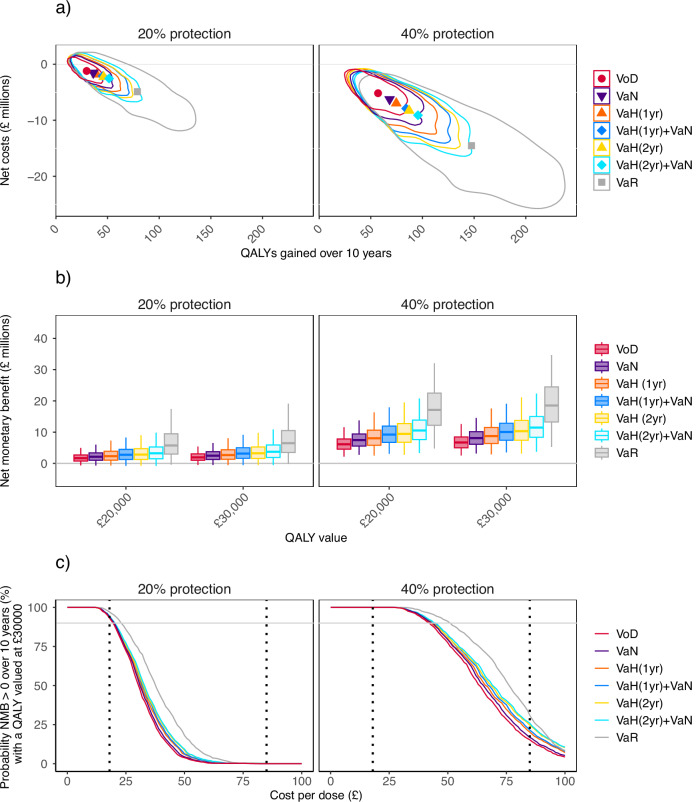
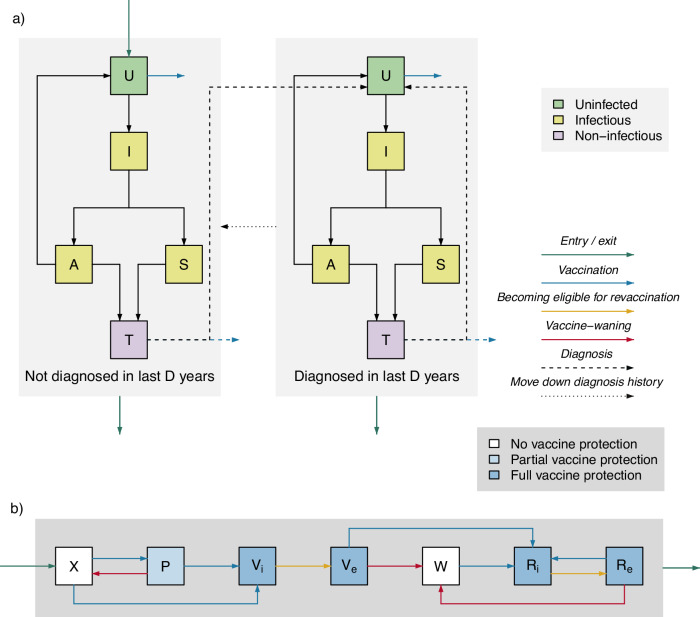
Vaccination for UK men who have sex with men (MSM) at increased gonorrhea risk has been advised, but not yet implemented. Effective targeting is essential for cost-effectiveness, but previously-examined approaches have disadvantages: Vaccination-on-Diagnosis has low coverage (limiting impact), and Vaccination-according-to-Risk requires asking about sexual behavior to identify at-risk individuals, which is not always feasible. We developed a transmission-dynamic model to evaluate novel strategies offering vaccination based on information readily available to clinicians (diagnostic/vaccination history, if the patient is seeking care due to partner notification). Offering vaccination to MSM who are notified partners of gonorrhea cases or were diagnosed themselves in the past 2 years averts 1.6x more cases and is more cost-effective than Vaccination-on-Diagnosis. If vaccination provides 20% protection for 1.5 years after primary vaccination and 3 years after revaccination then at £18/dose administered, all considered strategies have ≥50 and ≥90% probabilities of positive net monetary benefit compared with no vaccination with a quality-adjusted life year valued at £20,000 and £30,000 respectively, thus meeting the UK criteria for cost-effectiveness. All novel strategies considered achieve greater impact than Vaccination-on-Diagnosis without the feasibility issues of Vaccination-according-to-Risk.


Conflict of interest statement

Competing interests: L.K.W. has consulted for the Wellcome Trust. P.J.W. has received payment from Pfizer for teaching of mathematical modeling of infectious disease transmission and vaccination, and from the Dutch National Institute for Public Health and the Environment (RIVM) for participation in an audit committee on COVID-19 data analytics and modeling. T.L. and D.N. report no potential conflicts.

Figures

Fig. 1
Fig. 1. Annual numbers of gonorrhea cases averted and vaccine doses administered over the first 10 years of a vaccination program under different targeting strategies.
Vaccination strategies considered are Vaccination-on-Diagnosis (VoD); Vaccination-according-to-partner-Notification (VaN); Vaccination-according-to-History (VaH), offering vaccination to those with a diagnosis in the last year [VaH(1yr)] or in the last 2 years [VaH(2yr)]; VaN combined with VaH(1yr) or VaH(2yr); and Vaccination-according-to-Risk (VaR). Primary vaccination provides protection for 1.5 years, and booster vaccination protects for 3 years. Panels on the left and right show results for the vaccine providing 20 and 40% protection after two-dose primary vaccination, respectively. Section a shows the annual numbers of diagnoses averted, and section b shows the annual numbers of doses administered. Box plots depict results from 1000 sets of sampled epidemiological and health-economic parameters, with whiskers indicating the 2.5th and 97.5th centiles, boxes the 25th and 75th centiles, and the central line the median (50th centile).
Fig. 2
Fig. 2. Risk profile of vaccinated individuals and vaccination efficiency under different vaccination strategies over the first 10 years of a vaccination program under different targeting strategies.
Vaccination strategies considered are Vaccination-on-Diagnosis (VoD); Vaccination-according-to-partner-Notification (VaN); Vaccination-according-to-History (VaH), offering vaccination to those with a diagnosis in the last year [VaH(1yr)] or in the last 2 years [VaH(2yr)]; VaN combined with VaH(1yr) or VaH(2yr); and Vaccination-according-to-Risk (VaR). Section a Cumulative number of doses administered to low-activity men who have sex with men (MSM) against doses administered to high-activity MSM. Note the very different magnitudes of the horizontal and vertical scales; inset plots show the same mean values, but with the same scale on both axes. Point markers show mean values, while outlined regions show high-density regions which include 80% of model results VoD is shown with a circle marker, VaN is shown with a triangle pointing downwards, VaH(1yr) and VaH(2yr) are shown with a triangle pointing upwards, VaH(1yr) + VaN and VaH(2yr) + VaN are shown with diamond markers, and VaR is shown with a square marker. Section b the cumulative number of cases averted per dose administered. All plots use 1000 sets of sampled epidemiological and health-economic parameters. Box plot whiskers indicate the 2.5th and 97.5th centiles, boxes the 25th and 75th centiles, and the central line the median (50th centile).
Fig. 3
Fig. 3. Cost-effectiveness over the first 10 years of a vaccination program under different targeting strategies.
Vaccination strategies considered are Vaccination-on-Diagnosis (VoD); Vaccination-according-to-partner-Notification (VaN); Vaccination-according-to-History (VaH), offering vaccination to those with a diagnosis in the last year [VaH(1yr)] or in the last 2 years [VaH(2yr)]; VaN combined with VaH(1yr) or VaH(2yr); and Vaccination-according-to-Risk (VaR). Section a Cost-effectiveness planes, for a vaccine costing £18/dose administered. The x-axis shows quality-adjusted life years gained by each strategy over 10 years, while the y-axis shows net costs of each strategy over 10 years (negative costs indicate that savings in testing and treatment outweigh vaccination costs). VoD is shown with a circle marker, VaN is shown with a triangle pointing downwards, VaH(1yr) and VaH(2yr) are shown with a triangle pointing upwards, VaH(1yr) + VaN and VaH(2yr) + VaN are shown with diamond markers, and VaR is shown with a square marker. Point markers show mean values, while outlined regions show high-density regions, which include 80% of model results. Section b Box plots of the net monetary benefit of each strategy over 10 years, for a vaccine costing £18/dose administered and with a QALY valued at £20,000 or £30,000. Box plot whiskers indicate the 2.5th and 97.5th centiles, boxes the 25th and 75th centiles, and the central line the median (50th centile). Section c Probability that vaccination is cost-effective (i.e., net monetary benefit is positive, compared to no vaccination) at different costs per dose administered, with a QALY valued at £30,000. All plots use 1000 sets of sampled epidemiological and health-economic parameters.
Fig. 4
Fig. 4. Model structure diagram.
The population is divided into compartments representing different states of infection, and stratified according to diagnosis history and vaccination status. Note that there are separate sets of compartments for low and high sexual activity groups, which have identical arrangements of compartments and vaccination/diagnosis history strata. a Infection states and stratification by diagnosis history. Individuals enter the population uninfected (U); those leaving through aging leave from any state. Uninfected individuals can acquire infection, passing through an incubating state (I) before either developing symptoms (S) or remaining asymptomatic (A). Symptomatic individuals seek treatment due to symptoms, while a proportion of asymptomatic infections are identified via screening. Diagnosed individuals enter the treatment state (T). Treated individuals and untreated asymptomatic individuals who recover naturally return to U. Those diagnosed in the last D years (where D = 1 or 2) are distinguished from those never diagnosed or who were last diagnosed over D years ago. All treated individuals move into U in the “Diagnosed in the last D years” stratum. Over time, individuals in the “Diagnosed in the last D years” stratum move into the corresponding infection state in the “Not diagnosed in the last D years” stratum. Under all considered vaccine-targeting strategies, vaccination is offered to unprotected individuals diagnosed with (and treated for) gonorrhea. Under some strategies, vaccination is also offered to some uninfected individuals at screening (criteria in Table 1). Those who accept enter U in a vaccine-protected stratum. b Shows stratification according to vaccination status: unvaccinated (X), partially-vaccinated (P), fully-vaccinated (split into those who are ineligible for revaccination due to recent vaccination, Vi, and those who are eligible for revaccination, Ve), waned (W), and revaccinated (split into those who are ineligible due to recent revaccination, Ri, and those who are eligible for repeat vaccination, Re). Unvaccinated individuals in X who accept vaccination and receive one dose enter P, those who accept vaccination and receive two doses enter Vi, and those who decline vaccination remain in X. Individuals in P remain eligible for two-dose primary vaccination, those who choose to receive only one dose remain in P and those who receive two doses enter Vi. Individuals in Vi become eligible for single-dose booster vaccination after a period of EV years, moving to Ve. When vaccine protection wanes, partially vaccinated individuals return to X, while fully vaccinated individuals in Ve enter W. Individuals in Ve and W who accept single-dose booster vaccination enter Ri. Individuals in Ri become eligible for booster vaccination after a period of ER years, moving to Re. When protection from booster vaccination wanes, individuals move from Re back to W.

Similar articles

Cited by

References

    1. World Health Organization. Multi-drug resistant gonorrhoea. https://www.who.int/news-room/fact-sheets/detail/multi-drug-resistant-go... (2024).
    1. Tacconelli, E. et al. Discovery, research, and development of new antibiotics: the WHO priority list of antibiotic-resistant bacteria and tuberculosis. Lancet Infect. Dis.18, 318–327 (2018). - PubMed
    1. Unemo, M. et al. Sexually transmitted infections: challenges ahead. Lancet Infect. Dis.17, e235–e279 (2017). - PubMed
    1. Gottlieb, S. L. et al. Gonococcal vaccines: public health value and preferred product characteristics; report of a WHO global stakeholder consultation, January 2019. Vaccine38, 4362–4373 (2020). - PMC - PubMed
    1. Abara, W. E., Jerse, A. E., Hariri, S. & Kirkcaldy, R. D. Planning for a gonococcal vaccine: a narrative review of vaccine development and public health implications. Sex. Transm. Dis.48, 453–457 (2021). - PMC - PubMed

LinkOut - more resources