. 2025 Jun 21;12(1):1055.
doi: 10.1038/s41597-025-05379-w.

Enabling data-driven design of block copolymer self-assembly

Affiliations

Enabling data-driven design of block copolymer self-assembly

Chiara Magosso et al. Sci Data. .

Abstract

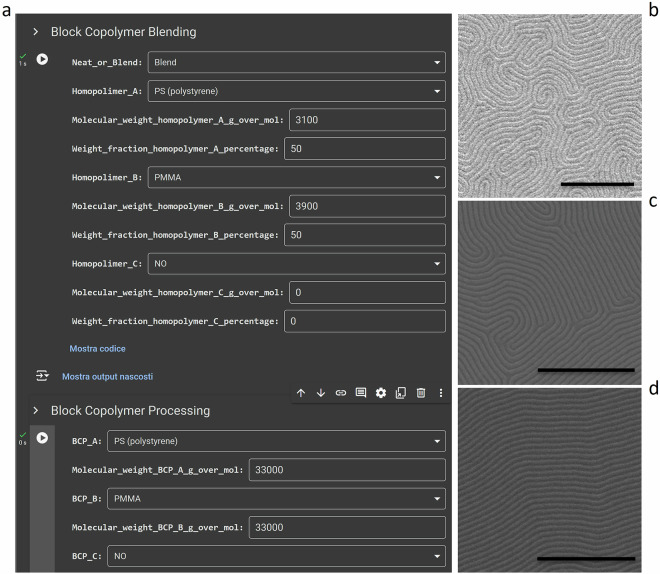
Here we present a database composed of scanning electron microscope images of self-assembled block copolymers. The fabrication process parameters, structural properties and microscope information are all contained in the image metadata, making a group of images a database on its own. This approach has numerous advantages including ease of sharing, reusability of information and resilience against user errors. This database follows the digital International System of Units principles and is complemented by a graphical user interface for process metadata insertion and an automated algorithm for image analysis to retrieve structural properties of the nanostructures. Databases such as this one, together with data-driven approaches, enable users to rationally design new materials with the desired properties by understanding the relationship between fabrication parameters and material structure. The here reported database, that contains around 1747 images of lamellar phase and lying down cylinders self-assembled block copolymers along with associated metadata, is structured so it can be continuously expanded by the research community including also samples with different block copolymers morphologies.


Conflict of interest statement

Competing interests: The authors declare no competing financial interest. Certain equipment, instruments, software, or materials are identified in this paper in order to specify the experimental procedure adequately. Such identification is not intended to imply recommendation or endorsement of any product or service by NIST, nor is it intended to imply that the materials or equipment identified are necessarily the best available for the purpose.

Figures

Fig. 1
Fig. 1
Workflow of database creation. The BCP self-assembly was performed at different experimental conditions. The samples were afterwards characterized via SEM imaging. Subsequent automated image analysis was conducted using Python and ImageJ, with metadata insertion performed using dedicated software to ensure data standardization. The resulting database was created in two formats: each image is accompanied by its own metadata, and a comma-separated values (CSV) file containing the metadata of the entire database. Both forms of the database can be used for aggregate data analysis and consequently rationally design new experiments.
Fig. 2
Fig. 2
Metadata insertion tool. (a) Application developed to insert process parameters into SEM images metadata in a standardized way between different laboratories by fixing unit of measures and nomenclature. (bd) Example SEM images (scale bar 500 nm).
Fig. 3
Fig. 3
Automated image analysis process flow. After reading the process parameters from the SEM image, we crop the scale bar (a) and perform a fast Fourier transform (b) in order to obtain the sample pitch (l0) value. Having sample pitch value and resolution, the Fingerprint-Enhancement-Python package, is used to binarize the pattern (c); the last step is to use the modified ADAblock macro to obtain the structural parameters (d). The automated analysis ends with the insertion of the extracted parameters into the image metadata.
Fig. 4
Fig. 4
Categorical graph reporting the process condition of data currently present in the database and number of images per system. (a) Every point represents one or more samples produced in that particular condition, described by number average molecular mass (Mn), temperature and time. Every sample was characterized by one or more SEM images taken on different areas of the sample. Note that the temperature values are categorical and an offset across the various systems is added in the x-axis to ensure the graph readability. The legend is structured as follows: the first element indicates the System. A corresponds to PS-b-PMMA, Neat, both samples from prior work and new samples; B corresponds to PS-b-PMMA, Blend with PS homopolymer (Mn = 3.1 kg/mol) and PMMA homopolymer (Mn = 3.9 kg/mol); C corresponds to PS-b-P(DMS-r-VMS), Neat. The second element indicates the number average molecular mass in [kg/mol], the third is the dispersity (PDI) while the fourth is the volume fraction of one block (f) that was determined from the number average molecular mass. (b) The bar height represents the number of images taken for each system divided by System and number average molecular mass in [kg/mol]. A total of 1747 images and 180 unique fabrication process conditions are included in the plots.
Fig. 5
Fig. 5
Histogram of sample pitch categorized by number average molecular mass. A total of 962 images are included in the plot.
Fig. 6
Fig. 6
Defect density as a function of processing temperature. (ac) By fixing for system A the number average molecular mass at 51 kg/mol and time at 60 s, we study the trend of different types of defect density as the temperature varies. SEM images (scale bars are 100 nm) with a detail of the different defect types and associated ADAblock markers are reported as insets. (a) Box and whisker plot of terminal points defect pair density. (b) Box and whisker plot of 3-way junction defect pair density. (c) Box and whisker plot of dot defect density. Orange lines represent the median, boxes represent the 25th to 75th percentile, whiskers are 1.5 IQR and empty circles are outliers. A total of 92 images are included in all of the plots.
Fig. 7
Fig. 7
Interlaboratory comparison. We study the sample pitch value of three different samples through two different characterization techniques. The dots represent the SEM measurements of the weighted average pitch where the uncertainty is standard error of mean determined via a weighted average of the pitch using the measured standard deviations as described in the methods section. The boxes represent the dispersions of the sample pitches measured by GISAXS where the uncertainty contributions can be found in the work of Murataj et al., the measurement and uncertainty are estimated according to the combined standard uncertainty described in the work of Wernecke et al..

Similar articles

Cited by

References

    1. Mai, Y. & Eisenberg, A. Self-assembly of block copolymers. Chem. Soc. Rev.41, 5969–5985 (2012). - PubMed
    1. Bates, C. M. & Bates, F. S. 50th Anniversary Perspective: Block Polymers—Pure Potential. Macromolecules50, 3–22 (2017).
    1. Yang, G. G. et al. Intelligent block copolymer self-assembly towards IoT hardware components. Nat. Rev. Electr. Eng.1, 124–138 (2024).
    1. Liu, C.-C. et al. Directed self-assembly of block copolymers for 7 nanometre FinFET technology and beyond. Nat. Electron.1, 562–569 (2018).
    1. Kim, J. Y. et al. Highly tunable refractive index visible-light metasurface from block copolymer self-assembly. Nat. Commun.7, 12911 (2016). - PMC - PubMed

LinkOut - more resources