. 2025 Jun 21;11(1):286.
doi: 10.1038/s41420-025-02571-0.

Development of translational read-through-inducing drugs as novel therapeutic options for patients with Fanconi anemia

Affiliations

Development of translational read-through-inducing drugs as novel therapeutic options for patients with Fanconi anemia

Anca Manuela Hristodor et al. Cell Death Discov. .

Abstract

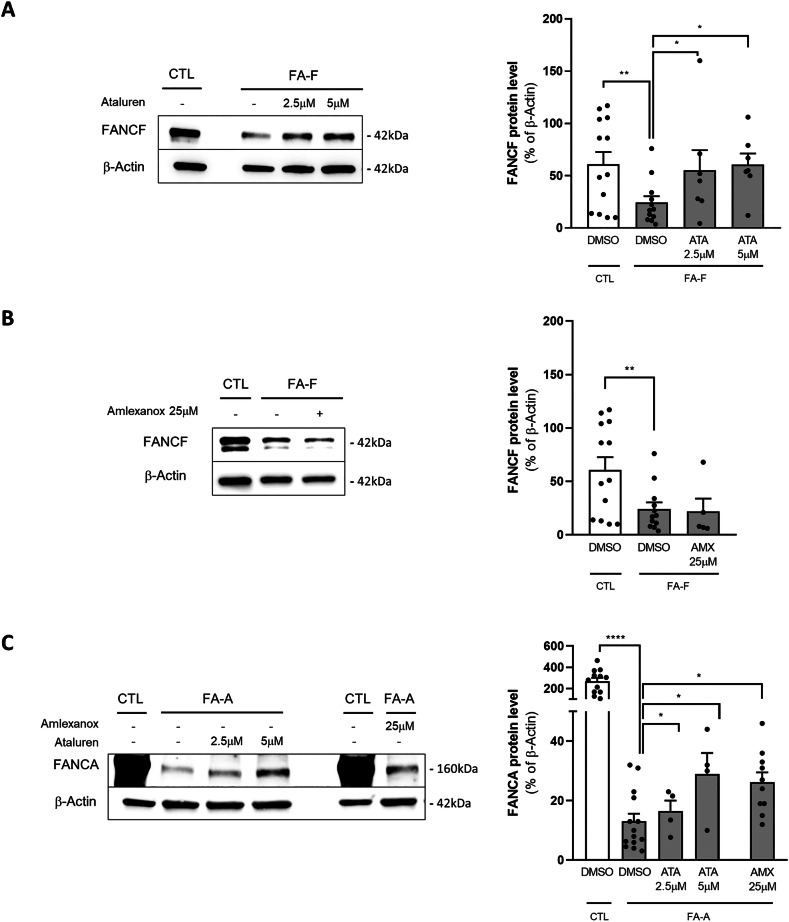
Fanconi anemia (FA) is caused by mutations affecting FANC genes involved in DNA repair, with nearly 20% of FA patients harboring nonsense mutations. Ataluren (PTC124) is a translational read-through-inducing drug (TRID) already approved in Europe that has a well-established safety profile even in pediatric patients. Amlexanox, an anti-inflammatory drug, also promotes read-through of premature stop codons caused by nonsense mutations. We compared ataluren and amlexanox in rescuing FANCA, FANCC and FANCF protein synthesis in lymphoblastoid cell lines and fibroblasts obtained from FA patients with nonsense mutations. While ataluren restored all FANC protein levels, amlexanox was partially effective only on FANCA. Notably, the rescue of FANC proteins resulted in a significant downregulation of p53. Moreover, unlike amlexanox, ataluren remarkably improved cell viability and reduced chromosomal aberrations upon exposure to genotoxic compounds. Amlexanox primarily reduced the signal transducer and activator of transcription 2 (STAT2) phosphorylation. Furthermore, FANCA-mutated fibroblasts exhibited a higher frequency of micronuclei formation as well as lower lamin B1 expression compared to their gene-edited counterpart re-expressing wild-type FANCA. Interestingly, ataluren significantly limited the generation of micronuclei in nonsense-mutated primary FANCC fibroblasts, restoring lamin B1 expression. This study represents a milestone of drug development for FA as it paves the way for clinical development of TRIDs, indicating ataluren as a promising approach to address the genetic instability and reduce the risk of malignant transformation in FA cells. Moreover, these results highlight the importance of a reliable experimental pipeline to assess whether minimal protein rescue via translational read-through can yield meaningful phenotypic rescue.


Conflict of interest statement

Competing interests: The authors declare no competing interests. Ethics: Ethics approval was not needed, as this study does not involve patients or animals.

Figures

Fig. 1
Fig. 1. Ataluren significantly increased both FANCF and FANCA protein expression, while amlexanox rescued only FANCA synthesis.
Representative Western blots (left panels) and corresponding protein quantification (right panels) after 24 h incubation with ataluren (2.5-5 μM) or amlexanox (25 μM) of FANCF (A, n = 7; B, n = 4) and FANCA (C, n = 5), in FA-F and FA-A mutated LCL, respectively. Data are mean ± SEM. The Shapiro-Wilk test was used to calculate normality, followed as appropriate by a nonparametric Wilcoxon test or paired t test (*p < 0.05; **p < 0.01; ****p < 0.0001).
Fig. 2
Fig. 2. Ataluren significantly reduced p53 expression levels in FA-F and FA-A mutated LCLs, while amlexanox reduced p53 solely in FA-A LCL.
Representative Western blots (left panels) and corresponding protein quantification (right panels) of p53 in FA-F mutated LCL after 24 h incubation with ataluren at 2.5μM and 5μM (A, n = 4); after 24 h incubation with amlexanox 25μM (B, n = 5); and in FA-A after ataluren (C, n = 7) and amlexanox (D, n = 10). Data are mean ± SEM. The Shapiro-Wilk test was used to calculate normality, followed as appropriate by a nonparametric Wilcoxon test or paired t test (*p < 0.05; **p < 0.01).
Fig. 3
Fig. 3. Ataluren significantly improved cell survival upon genotoxic treatment while limiting chromosomal aberrations.
Mitomycin C test of FA-F (A, n = 4) and FA-A (B, n = 7) LCL, after 24 h incubation with ataluren 5μM. DEB test of FA-F (C, E, G) and FA-A (D, F, H) LCL, after 1, 2 and 3 weeks of incubation with ataluren 2.5μM (in red) and 5μM (in blue). Data for the MMC test are mean ± SEM. The Shapiro–Wilk test was used to calculate normality, followed by a parametric t test with p calculated accordingly (*p < 0.05; **p < 0.01; ***p < 0.001). *, comparison between basal FA condition and treated FA condition; #, comparison between healthy donors and FA.
Fig. 4
Fig. 4. Amlexanox was not able to improve cell survival upon genotoxic treatment.
Mitomycin C test of FA-F (A) and FA-A (B) LCL, after 24 h incubation with amlexanox 25μM (n = 3). DEB test after 1, 2 and 3 weeks of incubation with amlexanox 25μM (in red) of FA-A LCL (CE). MMC test data are mean ± SEM. The Shapiro–Wilk test was used to calculate normality, followed by a parametric t test with p calculated accordingly (#p < 0.05; ##p < 0.01; ###p < 0.001). #, comparison between healthy donors and FA.
Fig. 5
Fig. 5. Amlexanox did not reduce the expression of pro-inflammatory markers but reduced the phosphorylation of STAT2.
Pro-inflammatory cytokines IL-6 (A, n = 3) and TNFα (B, n = 6), and mRNA expression levels in FA-A mutated LCL, after 24 h incubation with amlexanox 25μM (AMX), parthenolide 1μM (PT), hydrocortisone 20μg/ml (HC), NF-κB activation inhibitor 20 nM (NF-κBin), ataluren 5μM. pSTAT2 and STAT2 protein expression levels after AMX, PT, HC and NF-κBin (C, n = 5), and ATA (D, n = 4); expression of p53 (E, n = 4). Data are mean ± SEM. Welch’s ANOVA test (A, B), or mixed effect analysis (C, E) or one-way ANOVA (D) were used (*p < 0.05; **p < 0.01; ***p < 0.001; ****p < 0.0001).
Fig. 6
Fig. 6. FA-A fibroblasts are characterized by reduced lamin B1, increased vimentin and formation of numerous micronuclei.
Immunofluorescence staining of isogenic FANCA-mutant (OL-FCL) and FANCA-corrected (OL-FCL-Corr) fibroblasts for vimentin (green), lamin B1 (red) and DAPI (blue) (A). Quantification of fluorescence intensity of lamin B1 (B, n = 20) and vimentin (C, n = 20). Frequency of micronuclei in OL-FCL and OL-FCL-Corr fibroblasts was evaluated, counting almost 50 cells per field (D, n = 10 fields). Data are mean ± SEM. The Shapiro-Wilk test was used to calculate normality, followed as appropriate by a nonparametric Mann–Whitney test (B, C) or parametric t test (D) (***p < 0.001; ****p < 0.0001).
Fig. 7
Fig. 7. Ataluren increased lamin B1 levels, while reducing vimentin and micronuclei frequency in primary FA-C fibroblasts.
Immunofluorescence staining of primary FA-C nonsense-mutated fibroblasts, before and after 24 h of incubation with ataluren 5μM or amlexanox 25μM, for vimentin (green), lamin B1 (red) and DAPI (blue) (A). Quantification of fluorescence intensity of lamin B1 (B, n = 20) and vimentin (C, n = 20). Frequency of micronuclei in FA-C fibroblasts before and after treatment with ataluren or amlexanox was evaluated by counting at least 50 cells per field (D, n = 8 fields). Data are mean ± SEM. The Shapiro-Wilk test was used to calculate normality, followed as appropriate by a nonparametric Mann–Whitney test (B) or parametric t test (C, D) (*p < 0.05; ****p < 0.0001).
Fig. 8
Fig. 8. Proposed mechanism of action of ataluren and amlexanox.
While both ataluren and amlexanox should induce translational read-through (and thus reduce the DNA damage repair deficiency, which would also result in reduced p53 levels), amlexanox is not able to improve cell survival upon genotoxic stress. There is admittedly a partial effect on FANCA protein expression and p53 reduction, indicating a broader spectrum of action. In Fanconi Anemia, amlexanox may have a stronger effect downstream of the DNA damage by inhibiting TBK1/IKKε, as already described in the literature, thus reducing the throughput of the IRF3/IFN-I and STAT2 pathway as well as NF-κB activation. Of note, according to ENCODE data, TP53 is a target gene of IRF3 transcription factor: this could be the main cause of the observed reduction in p53, which in this case does not translate into an overall improvement in cell fitness.

References

    1. Fang C-B, Wu H-T, Zhang M-L, Liu J, Zhang G-J. Fanconi anemia pathway: mechanisms of breast cancer predisposition development and potential therapeutic targets. Front. Cell Dev Biol. 2020;8. - PMC - PubMed
    1. Abdul-Sater Z, Cerabona D, Potchanant ES, Sun Z, Enzor R, He Y, et al. FANCA safeguards interphase and mitosis during hematopoiesis in vivo. Experimental Hematol. 2015;43:1031–46.e1012. - PMC - PubMed
    1. Hatch EM, Fischer AH, Deerinck TJ, Hetzer MW. Catastrophic nuclear envelope collapse in cancer cell micronuclei. Cell. 2013;154:47–60. - PMC - PubMed
    1. Mackenzie KJ, Carroll P, Martin C-A, Murina O, Fluteau A, Simpson DJ, et al. cGAS surveillance of micronuclei links genome instability to innate immunity. Nature. 2017;548:461–5. - PMC - PubMed
    1. Ceccaldi R, Parmar K, Mouly E, Delord M, Kim JM, Regairaz M, et al. Bone marrow failure in fanconi anemia is triggered by an exacerbated p53/p21 DNA damage response that impairs hematopoietic stem and progenitor cells. Cell Stem Cell. 2012;11:36–49. - PMC - PubMed