. 2025 Jun 21;23(1):459.
doi: 10.1186/s12951-025-03536-2.

An imaging-guided self-amplifying photo-immunotherapeutic nanoparticle for STING pathway activation and enhanced cancer therapy

Affiliations

An imaging-guided self-amplifying photo-immunotherapeutic nanoparticle for STING pathway activation and enhanced cancer therapy

Qiaoqi Chen et al. J Nanobiotechnology. .

Abstract

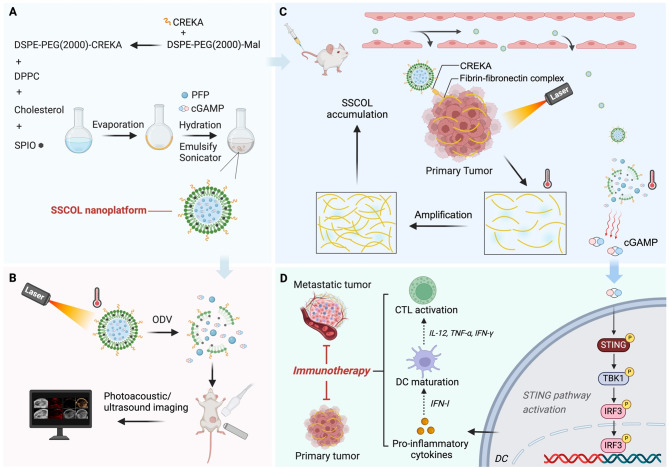
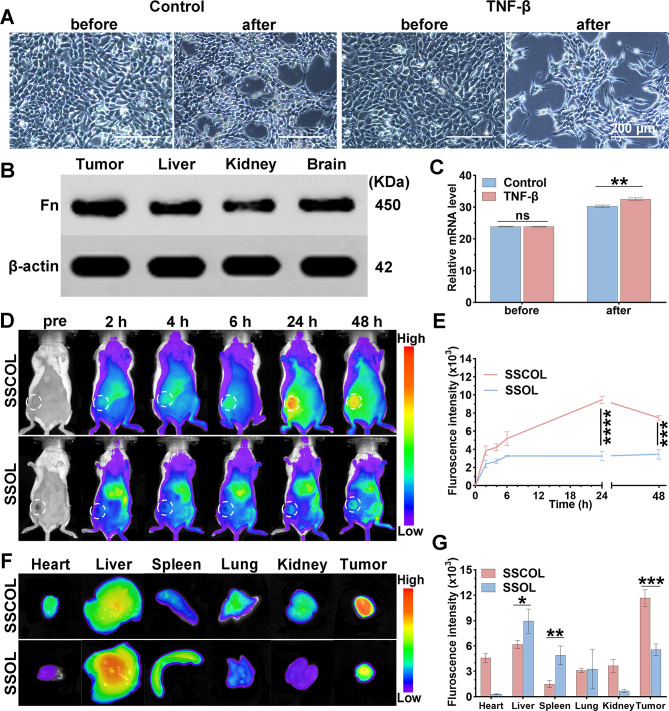
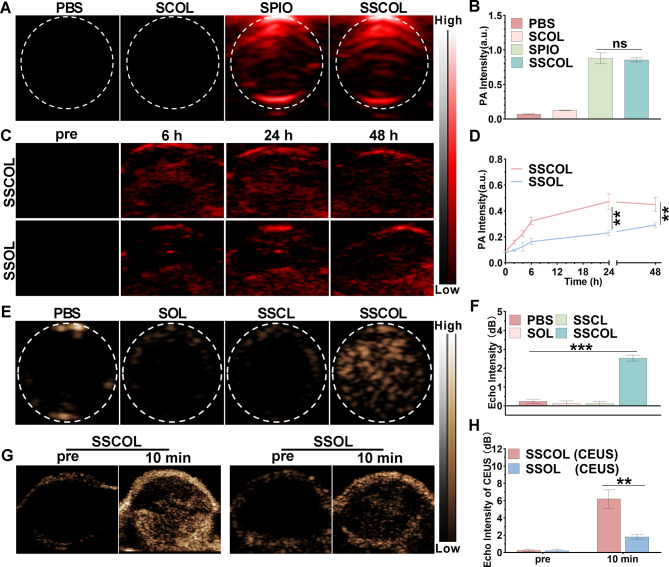
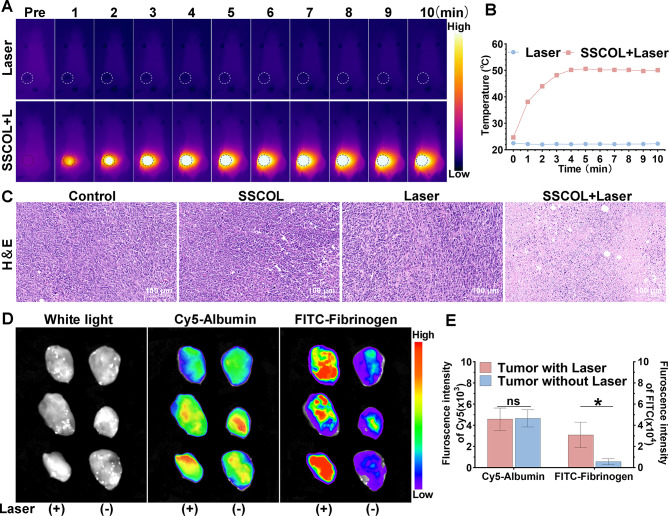
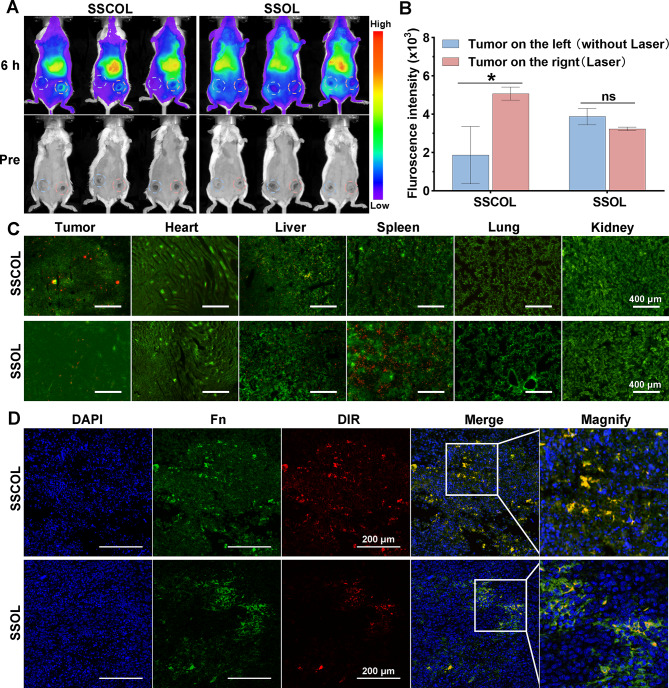
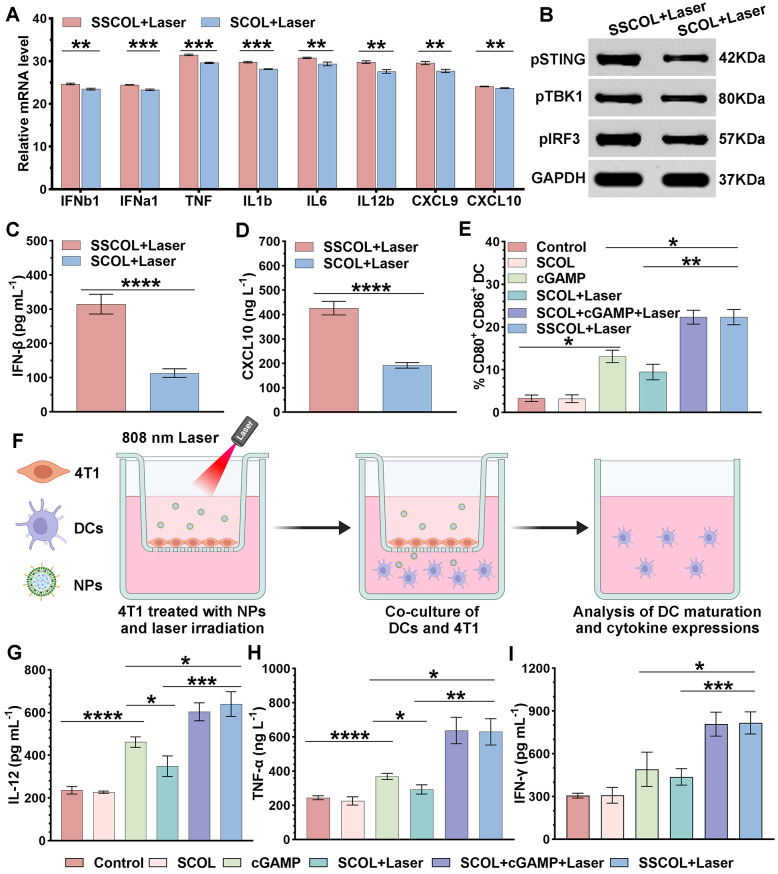
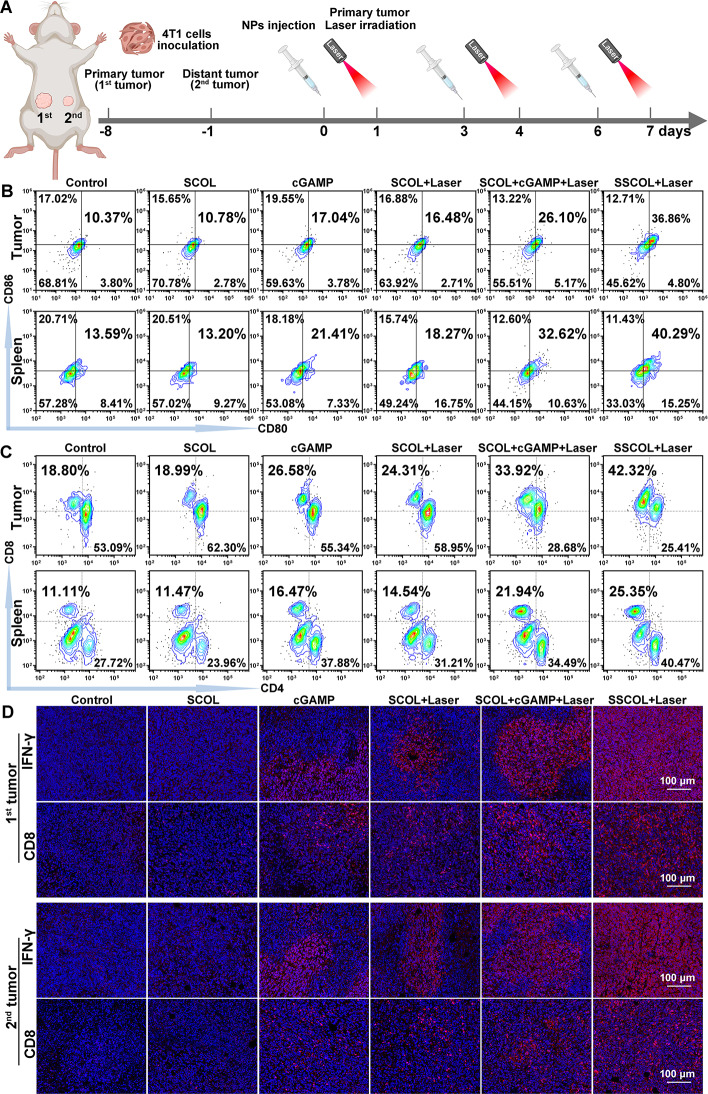
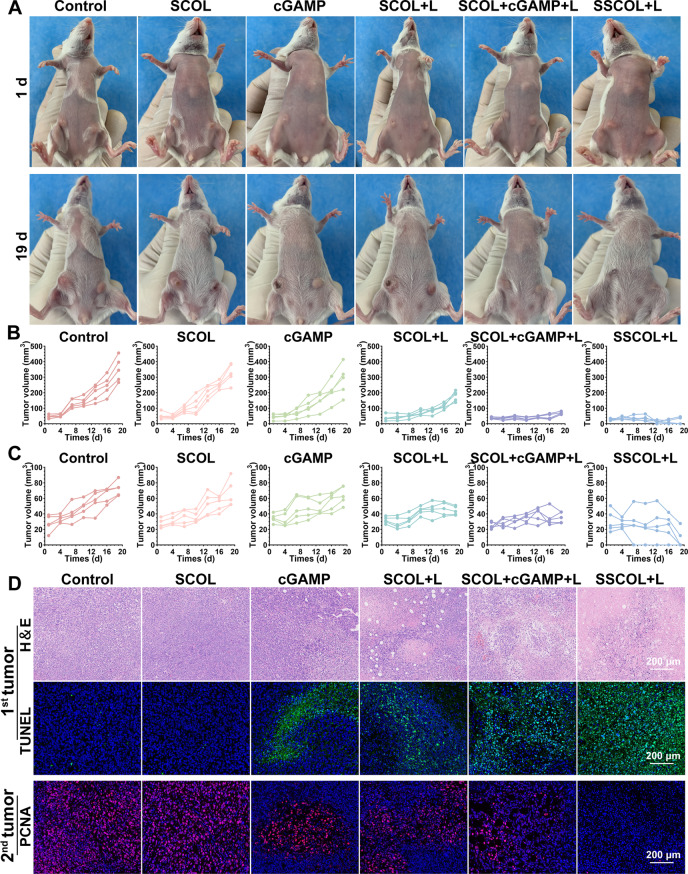
The stimulator of interferon genes (STING) pathway is a promising target in cancer immunotherapy. However, current nanomedicine strategies targeting the STING pathway often suffer from limited tumor specificity and insufficient immune activation. In this study, we developed a novel imaging-guided, self-amplifying photo-immunotherapeutic nanoparticle (SSCOL), comprising a liposome framework that encapsulates the phase-change material perfluoropentane (PFP), the photothermal agent superparamagnetic iron oxide (SPIO), and the STING agonist cGAMP. This nanoparticle exhibits excellent photoacoustic/ultrasound dual-modal imaging capability, enabling precise visualization of tumor tissue. CREKA enables specific binding to fibrin-fibronectin complexes in the tumor stroma, while NIR-induced photothermal effects of SPIO trigger coagulation, amplifying target formation and enhancing nanoparticle accumulation via a positive feedback mechanism. Under photothermal therapy, the phase transition of SSCOL enables the controlled and efficient release of the encapsulated cGAMP, which subsequently activates the STING pathway and triggers a pro-inflammatory cascade, enhances dendritic cell maturation and cytotoxic T lymphocyte activation, and elicits robust immune responses against both primary and metastatic tumors. Collectively, this multifunctional nanoparticle offers a promising strategy that integrates imaging, targeting, and photothermal-enhanced immune activation for STING-mediated cancer immunotherapy.

Keywords: Dual-modal imaging; Immunotherapy; Photothermal therapy; STING pathway; Targeting.


Conflict of interest statement

Declarations. Ethics approval and consent to participate: The animal experiments in this study were approved by the Animal Ethics Committee of the Second Affiliated Hospital of Chongqing Medical University (Coren Trial(265), 2021) and conducted at the Laboratory Animal Center of Chongqing Medical University. Consent for publication: All the authors have approved the manuscript to publish. Competing interests: The authors declare no competing interests.

Figures

Scheme 1
Scheme 1
(A) Schematic of SSCOL synthesis. (B) Mechanism of photoacoustic/ultrasound dual-modal imaging. (C) Positive feedback between fibronectin-fibrin complex formation and SSCOL targeting. (D) PTT-induced STING pathway activation for enhanced immunotherapy against primary and metastatic tumors
Fig. 1
Fig. 1
Characterization, photothermal conversion and ODV of SSCOL. (A) The TEM micrograph of SSCOL. Scale = 500 nm. (B) Magnified TEM micrographs. Scale = 100 nm. (C, D) Elemental mapping of SSCOL. Scale = 100 nm. (E) Diameters of SSCOL and SSOL (inset: digital photo of SSCOL). (F) MALDI-TOF-MS spectra of DSPE-PEG2000-CREKA and DSPE-PEG2000. (G) HPLC spectra of different concentrations of cGAMP. (H) Photothermal temperature-time curves of SSCOL at various concentrations under 808 nm laser irradiation (2 W·cm⁻²). (I) Photothermal temperature-time curves of SSCOL (2 mg·mL⁻¹) at different power densities of 808 nm laser. (J) The accumulative drug release of cGAMP from SSCOL. (K) Optical microscopy images of SSCOL before and after heating to different temperatures. Scale = 200 μm. (L) Optical microscopy images (upper) of SSCOL at various time points and the corresponding infrared thermal images (lower). Scale = 100 μm
Fig. 2
Fig. 2
Cellular uptake and photothermal cytotoxicity of SSCOL. (A) CLSM images of 4T1 cells after co-incubation with SSCOL and SSOL at various time points. Scale = 100 μm. (B) Flow cytometry analysis of SSCOL and SSOL in 4T1 cells at various time points. (C) The corresponding quantitative data. (D) Cell viability of 4T1 cells after different treatments. (E) CLSM images of 4T1 cells after Calcein-AM/PI staining. Red fluorescence refers to dead cells, and green fluorescence refers to live cells. Scale = 100 μm. (F) Flow cytometry analysis of 4T1 cell apoptosis ratios after different treatments. (G) The corresponding quantitative data. (ns: not significant; **p < 0.01, ****p < 0.0001)
Fig. 3
Fig. 3
The fibronectin expression in tumor and in vivo biodistribution of SSCOL. (A) Optical microscopy images of 4T1 cells before and after co-incubation with TGF-β. Scale = 100 nm. (B) Western blot assay of fibronectin (Fn) expression in tumor, liver, kidney, and brain tissues. (C) RT-PCR assay of fibronectin expression in 4T1 cells before and after co-incubation with TGF-β. (D) NIR fluorescence images of 4T1 tumor-bearing BALB/c mice after administrations of SSCOL and SSOL (without CREKA) at different time points. (E) The corresponding time-fluorescence intensity curves. (F) Ex vivo NIR fluorescence images of SSCOL and SSOL. (G) The corresponding quantitative fluorescence data. (ns: not significant; *p < 0.05; **p < 0.01, ***p < 0.001, ****p < 0.0001)
Fig. 4
Fig. 4
Photoacoustic/ultrasound dual-modal imaging. (A) In vitro PA images of SSCOL, free SPIO, SCOL (without SPIO) and PBS. (B) The corresponding PA signal intensities. (C) In vivo PA images of tumor regions at various time points after intravenous injection with SSCOL and SSOL (without CREKA). (D) The corresponding time-PA signal intensities curves. (E) In vitro ultrasound images of SSCOL, SSCL (without PFP) and SOL following 808 nm laser irradiation. (F) The corresponding echo signal values. (G) In vivo ultrasound images of the tumor regions at 24 h after intravenous injection with SSCOL and SSOL pre-irradiation and post-irradiation for 10 min. (H) The corresponding echo signal values. (ns: not significant; **p < 0.01, ***p < 0.001)
Fig. 5
Fig. 5
In vivo photothermal efficacy and the activation of the coagulation cascade induced by PTT. (A) Infrared thermal images of tumor-bearing mice under 808 nm laser irradiation at various time points. (B) The corresponding time-photothermal temperature curves. (C) H&E-stained images of tumor tissues after different treatments. Scale = 100 μm. (D) Ex vivo NIR fluorescence images of Cy5-albumin and FITC-fibrinogen in tumor tissues with laser irradiation versus without laser irradiation. (E) The corresponding quantitative fluorescence data. (ns: not significant; *p < 0.05)
Fig. 6
Fig. 6
The enhanced tumor-targeting performance of SSCOL following PTT. (A) NIR fluorescence images of bilateral tumor-bearing mice before and 6 h post-injection of SSCOL and SSOL (without CREKA), following PTT on one side of tumor. (B) The corresponding quantitative fluorescence data. (C) CLSM images of SSCOL and SSOL (red) in tumor and major organs. Scale = 400 μm. (D) Immunofluorescence images of fibronectin (Fn, green) and nanoparticles (red). Scale = 200 μm. (ns: not significant; *p < 0.05)
Fig. 7
Fig. 7
The activation of the STING pathway, and in vitro assessment of DC maturation and related cytokine secretion. (A) RT-PCR assay of the key cytokine levels related to STING pathway in DCs. (B) Western blot assay of the key proteins related to the STING pathway in DCs. (C, D) ELISA assay of cytokine levels of IFN-β and CXCL10 in serum of tumor-bearing mice. (E) Flow cytometry analysis of DC maturation through Transwell systems. (F) Schematic diagram depicted the Transwell systems. (G,H and I) Secretion of IL-12, TNF-α, and IFN-γ in cell supernatants by ELISA assay. (ns: not significant; *p < 0.05, **p < 0.01, ***p < 0.001, ****p < 0.0001)
Fig. 8
Fig. 8
In vivo anti-tumor immunity. (A) Schematic illustration of the in vivo experimental schedule. (B) Flow cytometry analysis of DC maturation (CD11c+ CD80+ CD86+) in tumor and spleen to show the populations of matured DCs. (C) Flow cytometry analysis of CD4+T cells and CD8+T cells in tumor and spleen. (D) Immunofluorescence images of IFN-γ and effector CD8+T cell in primary (1st) tumor and metastatic (2nd) tumor after different treatments. Scale = 100 μm
Fig. 9
Fig. 9
The synergistic anti-tumor efficacy. (A) Digital photos of tumor-bearing mice at day 1 and 19 after different treatments. (B) Growth curves of the primary tumor (1st) and (C) the metastatic tumor (2nd) on mice. (D) H&E and TUNEL staining of primary tumors and PCNA staining of metastatic tumors. Scale = 200 μm

Similar articles

References

    1. Siegel RL, Miller KD, Jemal A. Cancer statistics, 2017. CA Cancer J Clin. 2017;67:7–30. - PubMed
    1. Dean M, Fojo T, Bates S. Tumour stem cells and drug resistance. Nat Rev Cancer. 2005;5:275–84. - PubMed
    1. Liu M, Yang J, Xu B, Zhang X. Tumor metastasis: Mechanistic insights and therapeutic interventions. MedComm (2020) 2021;2:587–617. - PMC - PubMed
    1. Mellman I, Coukos G, Dranoff G. Cancer immunotherapy comes of age. Nature. 2011;480:480–9. - PMC - PubMed
    1. Yalamandala BN, Moorthy T, Liu ZH, Huynh TMH, Iao HM, Pan WC, Wang KL, Chiang CS, Chiang WH, Liao LD, et al. A Self-Cascading catalytic therapy and antigen capture Scaffold-Mediated T cells augments for postoperative brain immunotherapy. Small. 2025;21:e2406178. - PubMed