. 2025 Jun 21;26(1):219.
doi: 10.1186/s12931-025-03299-2.

Inhibition of the ATP synthase c subunit ameliorates HDM/LPS-induced inflammatory responses in asthmatic bronchial epithelial cells by blocking the mPTP-mtDNA-cGAS-STING axis

Affiliations

Inhibition of the ATP synthase c subunit ameliorates HDM/LPS-induced inflammatory responses in asthmatic bronchial epithelial cells by blocking the mPTP-mtDNA-cGAS-STING axis

Decai Wang et al. Respir Res. .

Abstract

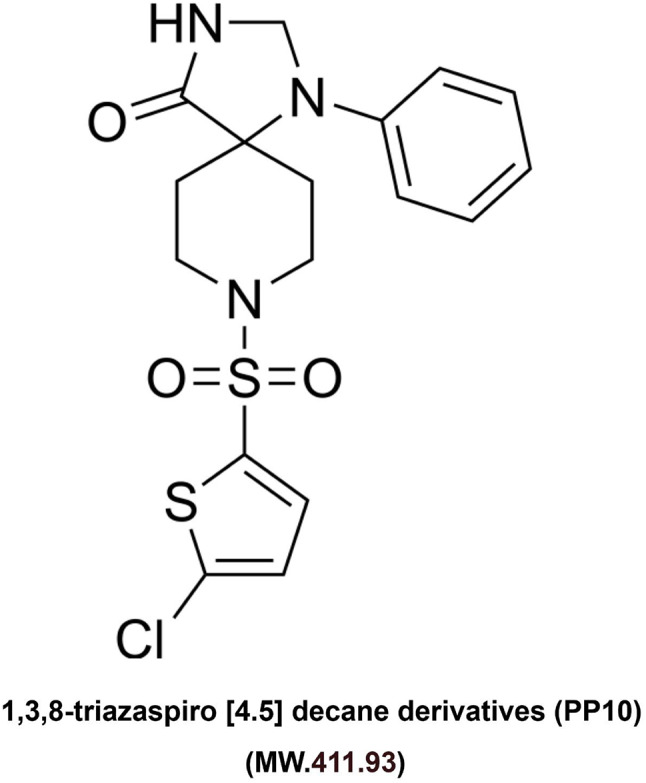
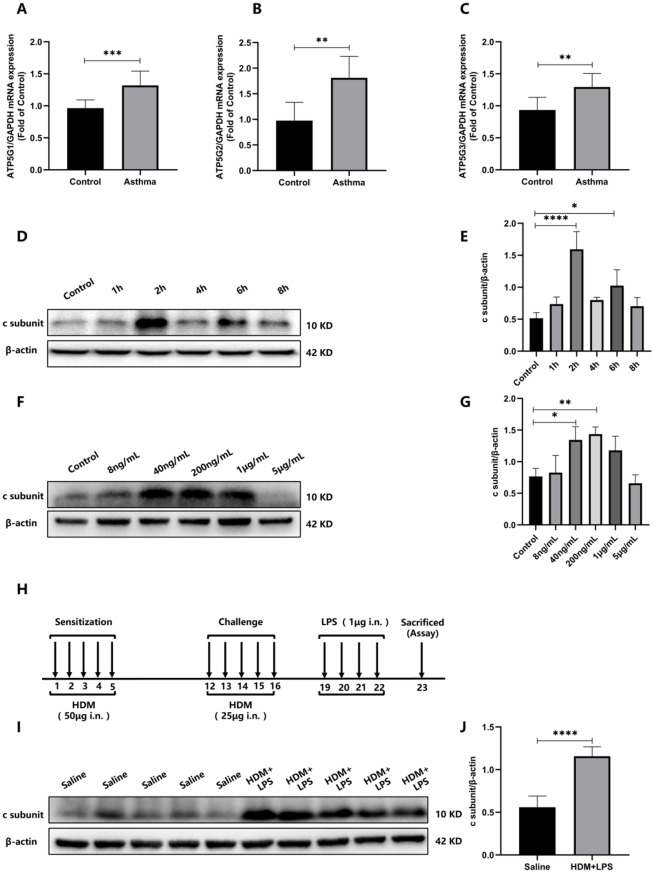
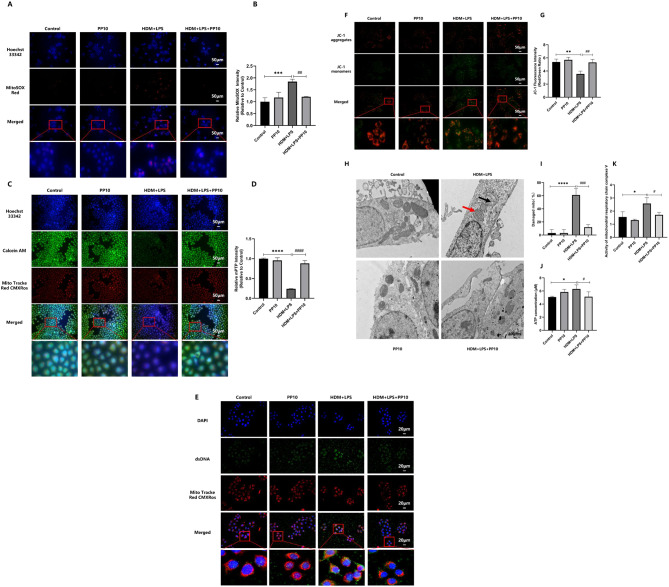
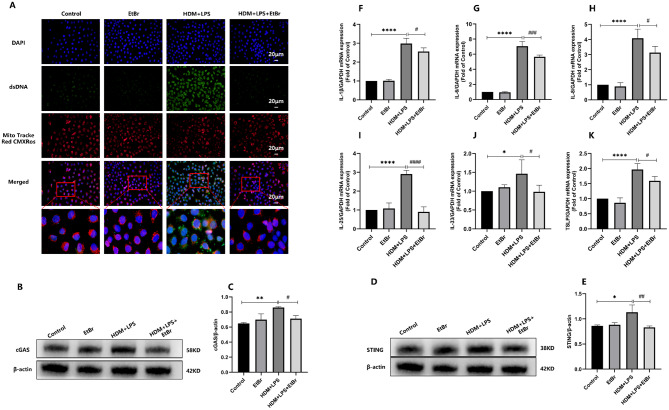
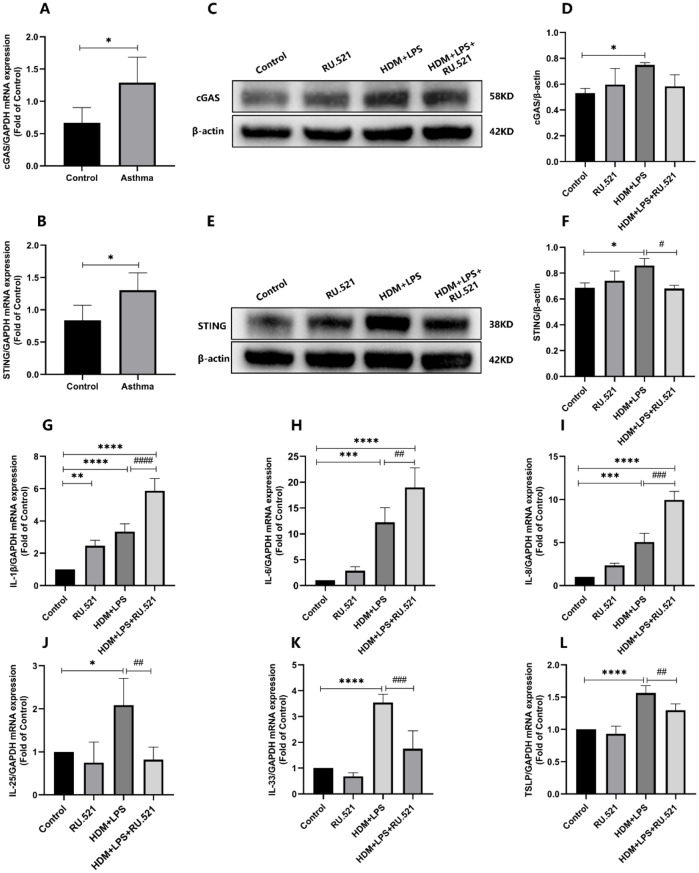
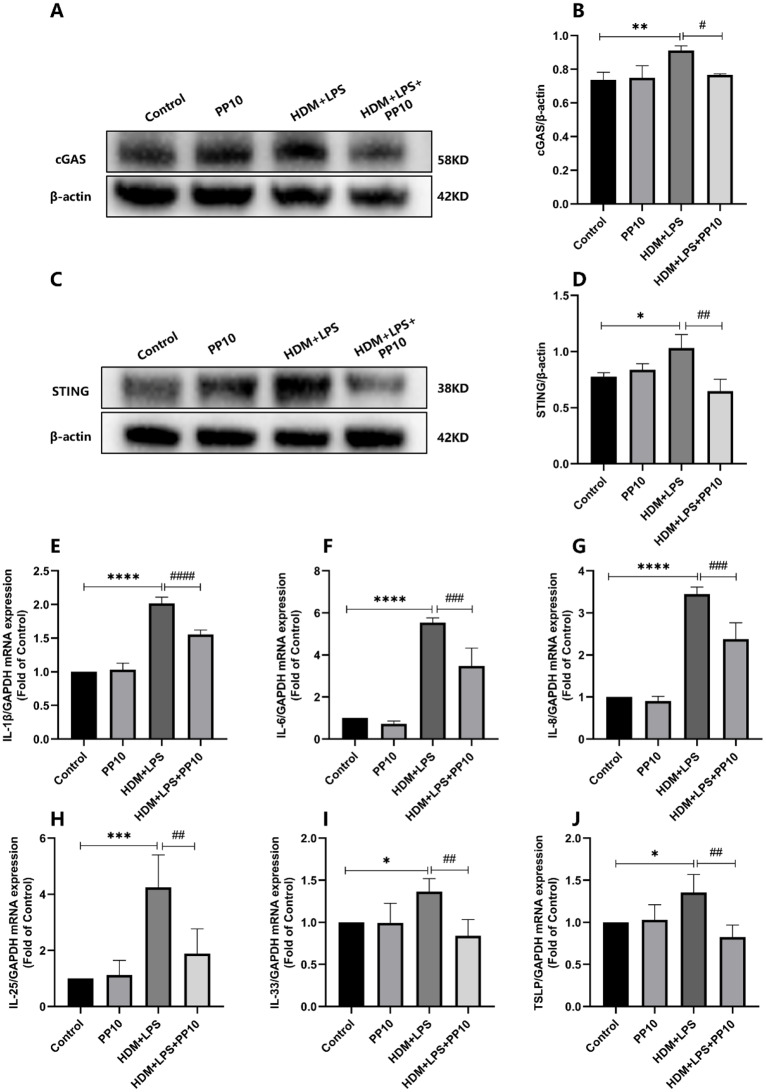
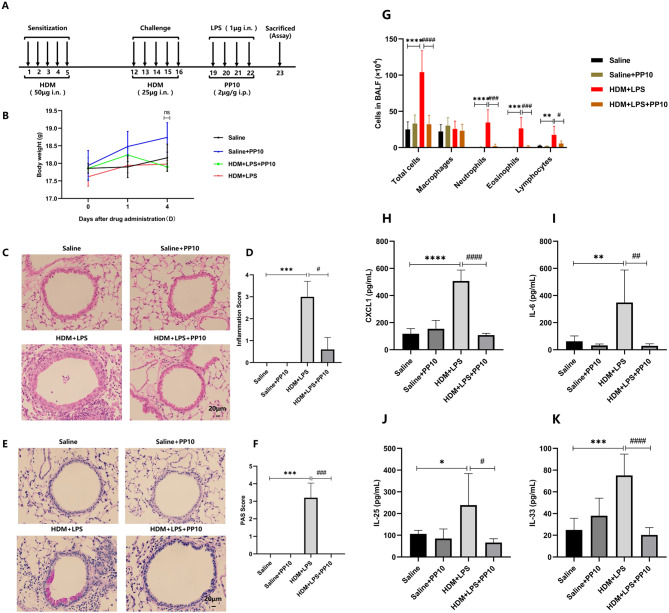
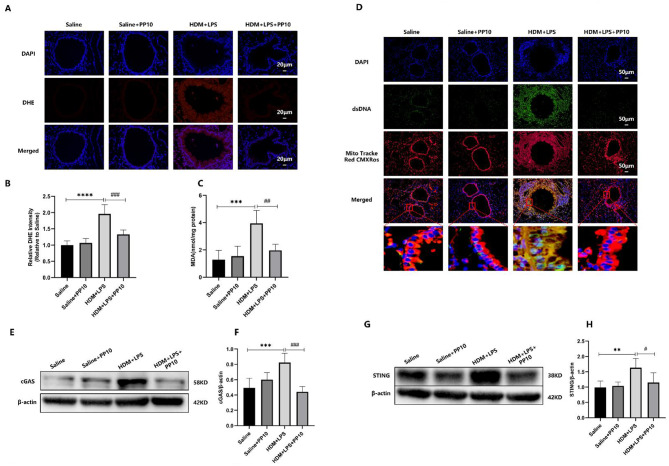
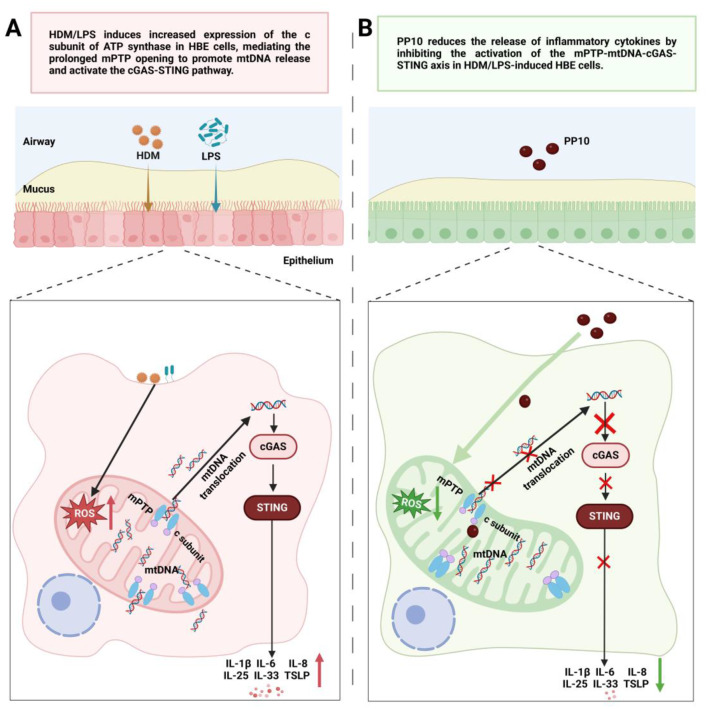
The ATP synthase c subunit (c subunit) constitutes the mitochondrial permeability transition pore (mPTP). The extended opening of the mPTP is crucial in the development of various human illnesses. Nevertheless, it remains unclear whether the c subunit regulates the prolonged opening of the mPTP to attenuate inflammatory responses in asthma. This study sought to clarify the impact of the c subunit on inflammatory responses and to examine the therapeutic effects of 1,3,8-triazaspiro [4.5] decane derivatives (PP10), a c subunit inhibitor, in human bronchial epithelial (HBE) cells induced by house dust mite (HDM) and lipopolysaccharide (LPS), as well as in a mouse model. The findings indicated that the expression of the c subunit is elevated in asthmatic patients, HDM/LPS-induced HBE cells, and asthmatic mice. The inhibition of the c subunit by PP10 alleviated the prolonged opening of mPTP, then blocked the release of mitochondrial DNA (mtDNA) and cyclic GMP-AMP synthase (cGAS)-interferon response cGAMP interactor (STING) pathway activation in HDM/LPS-induced HBE cells. Furthermore, PP10 decreased the secretion of inflammatory cytokines and ameliorated airway inflammation in HDM/LPS-induced HBE cells and asthmatic animals, respectively. The data collectively suggest that the c subunit triggers an inflammatory response by promoting the sustained opening of mPTP, leading to the activation of the mtDNA-GAS-STING pathway in HDM/LPS-induced HBE cells. Inhibition of the c-subunit attenuates inflammatory responses in HDM/LPS-induced cells or mouse models. Clinical trial number Not applicable.

Keywords: ATP synthase c subunit; Airway epithelial cells; Asthma; Inflammatory responses; Mitochondria; Mitochondrial permeability transition pore.


Conflict of interest statement

Declarations. Ethics approval and consent to participate: The deployment of human medical records and biological samples from human subjects was conducted in accordance with the tenets set forth in the Declaration of Helsinki. Informed consent was obtained from all participants. All experimental protocols related to human samples and animal experiments were approved by the Ethics Committee of Tongji Hospital affiliated with Tongji Medical College of Huazhong University of Science and Technology (TJ-IRB202404061 and TJH-202310017). Consent to publish: Not applicable. Competing interests: The authors declare no competing interests.

Figures

Fig. 1
Fig. 1
Chemical structure of 1,3,8-Triazaspiro [4.5] decane derivatives (PP10)
Fig. 2
Fig. 2
The expression of c subunit is upregulated in human airway epithelial cells and lung tissues from HDM/LPS-induced asthmatic mouse. (A-C) Transcript levels of the c subunit (ATP5G1-3) in human epithelial cells from healthy controls (n = 8) and asthmatic patients (n = 8) were determined by quantitative real-time PCR. (D) Expression of c subunit was analyzed by western blotting in HBE cells were treated with HDM (50 µg/mL)/ LPS (200 ng/mL) at different time points. (E) Quantitative analysis of Fig. 2D (n = 3). (F) Expression of c subunit was analyzed by western blotting in HBE cells were treated with HDM (50 µg/mL)/LPS (8 ng/mL, 40 ng/mL, 200 ng/mL, 1 µg/mL, or 5 µg/mL, respectively) at different concentrations for 2 h. (G) Quantitative analysis of Fig. 2F (n = 3). (H) Schematic diagram of asthma mouse model establishment. (I) Expressions of c subunit was analyzed by western blotting in lung tissues from the HDM/LPS-induced asthma mouse model. (J) Quantitative analysis of Fig. 2I (n = 5). Data are presented as mean ± SD or median with IQR. Statistical analyses were performed using Student’s t-test, Mann-Whitney U test, or one-way ANOVA as appropriate. *P < 0.05, **P < 0.01, ***P < 0.001, ****P < 0.0001. HBE, human bronchial epithelial. HDM, house dust mite. LPS, lipopolysaccharide
Fig. 3
Fig. 3
Pharmacological suppression of the c subunit enhanced mitochondrial function in HBE cells. HBE cells were pretreated with 1,3,8-Triazaspiro [4.5] decane derivatives (PP10, an inhibitor of c subunit, 5 µM) for 1 h followed by exposure to HDM (50 µg/mL) and LPS (40 ng/mL) for 24 h. (A) Images showed the ROS in red. Scale bar = 50 μm. (B) Quantitative analysis of MitoSOX fluorescence signal (n = 3). (C) Images showed green when the mPTP was closed. Scale bar = 50 μm. (D) Quantitative analysis of the fluorescence signal of mPTP (n = 3). (E) Immunofluorescence images of dsDNA expression in HBE cells (n = 3). Scale bar = 20 μm. (F) The JC1-aggregates fluoresce red and indicate high ΔΨm, while the monomers fluoresce green and indicate low ΔΨm. Scale bar = 50 μm. (G) Quantitative analysis of the fluorescence signal of the J-aggregates (red)/the monomers (green) (n = 3). (H) The mitochondrial morphology in HBE cells of the indicated groups was examined via TEM. Scale bar = 400 nm. Arrowheads in red and black indicate reduced and disappearing cristae and vacuolar degeneration and swelling of mitochondria, respectively. (I) Quantitative analysis of damaged mitochondria (n = 3). (J) Intracellular ATP levels were measured using an ATP assay kit (n = 4). (K) The activities of MRC complex V were determined by a colorimetric assay using the MRC Complex V Activity Assay Kit (n = 3). Data are expressed as mean ± SD, one-way ANOVA. Compared with Control group: *P < 0.05, **P < 0.01, ***P < 0.001, ****P < 0.0001. Compared with HDM + LPS group: #P < 0.05, ##P < 0.01, ####P < 0.0001. mPTP, mitochondrial permeability transition pore. ΔΨm, mitochondrial membrane potential. TEM, transmission electron microscope. MRC, mitochondrial respiratory chain
Fig. 4
Fig. 4
Cytoplasmic mtDNA activated the cGAS-STING pathway in HBE cells under HDM/LPS exposure. HBE cells were treated with EtBr (450 ng/mL, 72 h) to deplete mtDNA and subsequently incubated with HDM (50 µg/mL) or LPS (40 ng/mL) for 24 h. (A) Immunofluorescence images of dsDNA expression in HBE cells (n = 3). Scale bar = 20 μm. (B) Expression of cGAS was analyzed by western blotting. (C) Quantitative analysis of Fig. 4B (n = 3). (D) Expression of STING was analyzed by western blotting. (E) Quantitative analysis of Fig. 4D (n = 3). (F-K) The mRNA levels of (F) IL-1β, (G) IL-6, (H) IL-8, (I) IL-25, (J) IL-33 and (K) TSLP were determined by quantitative real-time PCR in HBE cells (n = 4). Data are expressed as mean ± SD, one-way ANOVA. Compared with Control group: *P < 0.05, **P < 0.01, ****P < 0.0001. Compared with HDM + LPS group: #P < 0.05, ##P < 0.01, ###P < 0.001, ####P < 0.0001. EtBr, ethidium bromide. mtDNA, mitochondrial DNA. cGAS, cyclic GMP-AMP synthase. STING, interferon response cGAMP interactor
Fig. 5
Fig. 5
cGAS-STING pathway activation was associated with HDM/LPS-induced inflammation. HBE cells were pretreated with RU.521 (an inhibitor of cGAS, 10 µM) for 1 h followed by exposure to HDM (50 µg/mL) and LPS (40 ng/mL) for 24 h. (A-B) Transcript levels of the cGAS and STING in human epithelial cells from healthy controls (n = 8) and asthmatic patients (n = 8) were determined by quantitative real-time PCR. (C) Expression of cGAS was analyzed by western blotting. (D) Quantitative analysis of Fig. 5C (n = 3). (E) Expression of STING was analyzed by western blotting. (F) Quantitative analysis of Fig. 5E (n = 3). (G-J) The mRNA levels of (G) IL-1β, (H) IL-6, (I) IL-8, (J) IL-25, (K) IL-33 and (L) TSLP were determined by quantitative real-time PCR in HBE cells (n = 4). Data are expressed as mean ± SD, student’s t-test or one-way ANOVA. Compared with Control group: *P < 0.05, **P < 0.01, ***P < 0.001, ****P < 0.0001. Compared with HDM + LPS group: #P < 0.05, ##P < 0.01, ###P < 0.001, ####P < 0.0001
Fig. 6
Fig. 6
Pharmacological suppression of the c subunit blocked activation of the mtDNA-cGAS-STING pathway in HBE cells. HBE cells were pretreated with PP10 (5 µM) for 1 h followed by HDM (50 µg/mL) and LPS (40 ng/mL) exposure for 24 h. (A) The expression of cGAS was analyzed by western blotting. (B) Quantitative analysis of Fig. 6A (n = 3). (C) The expression of STING was analyzed by western blotting. (D) Quantitative analysis of Fig. 6C (n = 3). (E-J) The mRNA levels of (E) IL-1β, (F) IL-6, (G) IL-8, (H) IL-25, (I) IL-33 and (J) TSLP were determined by quantitative real-time PCR in HBE cells (n = 4). Data are expressed as mean ± SD, one-way ANOVA. Compared with Control group: *P < 0.05, **P < 0.01, ***P < 0.001, ****P < 0.0001. Compared with HDM + LPS group: #P < 0.05, ##P < 0.01, ###P < 0.001, ####P < 0.0001
Fig. 7
Fig. 7
PP10 relieved HDM/LPS-induced airway inflammatory response in an experimental mouse model of asthma. (A) Schematic representation of the murine asthma model induction and therapeutic administration protocol. (B) Mice were weighed on the day of modelling (day 0), on the day of drug administration (day 1), and on the day of the end of drug administration (day 4) to assess the effect of PP10 on growth and development (n = 5). (C-D) HE staining was performed on lung sections in the indicated groups. Scale bar = 20 μm. Quantification of inflammatory infiltration was made using inflammation scores (n = 5). (E-F) PAS staining was performed on lung sections in the indicated groups. Scale bar = 20 μm. Quantification of hyperplasia of goblet cells was made using PAS scores (n = 5). (G) Statistical analysis of the neutrophils, eosinophils, lymphocytes, macrophages and total inflammatory cells in BALF (n = 5). (H-K) ELISA-based measurement and statistical analysis of CXCL1(H), IL-6 (I), IL-25 (J) and IL-33 (K) in BALF (n = 5). Data are presented as mean ± SD or median with IQR. Statistical analyses were performed using one-way ANOVA or Kruskal-Wallis test, as suitable for the data distribution. Compared with Saline group: *P < 0.05, **P < 0.01, ***P < 0.001, ****P < 0.0001. Compared with HDM + LPS group: #P < 0.05, ##P < 0.01, ###P < 0.001, ####P < 0.0001. ns: no significance
Fig. 8
Fig. 8
Pharmacological suppression of the c subunit blocked activation of the mtDNA-cGAS-STING pathway in the lung of asthmatic mice. (A) Immunofluorescence images of ROS expression with DHE in lung tissues from HDM/LPS-induced mouse model of asthma treated with or without PP10 (2 mg/kg, i.p.). Scale bar = 20 μm. (B) Quantitative analysis of the fluorescence signal of DHE (n = 5). (C) Mouse lung tissues were homogenized to measure the levels of MDA (n = 4). (D) Immunofluorescence images of dsDNA expression in the lung tissues of mice (n = 5). Scale bar = 50 μm. (E) The expression of cGAS was analyzed by western blotting. (F) Quantitative analysis of Fig. 8E (n = 5). (G) The expression of STING was analyzed by western blotting. (H) Quantitative analysis of Fig. 8G (n = 5). Data are expressed as mean ± SD, one-way ANOVA. Compared with Saline group: **P < 0.01, ***P < 0.001, ****P < 0.0001. Compared with HDM + LPS group: #P < 0.05, ##P < 0.01, ###P < 0.001. DHE, dihydroethidium
Fig. 9
Fig. 9
A mechanistic diagram summarizing the regulatory effect of the c subunit on the prolonged opening of mPTP in HDM/LPS-induced HBE cells. (A) HDM/LPS induces increased expression of the c subunit of ATP synthase in HBE cells, mediating the prolonged mPTP opening to promote mtDNA release and activate the cGAS-STING pathway. (B) PP10 reduces the release of inflammatory cytokines by blocking the prolonged mPTP opening to inhibit the activation of the mtDNA-cGAS-STING axis in the HDM/LPS-induced HBE cells

Similar articles

References

    1. Al Heialy S, Ramakrishnan RK, Hamid Q. Recent advances in the Immunopathogenesis of severe asthma. J Allergy Clin Immunol. 2022;149:455–65. - PubMed
    1. Samanas NB, Murphy RC, Miralda I, Hallstrand TS, Piliponsky AM. Neutrophilic asthma at an inhibitory checkpoint: A PD-1-targeted approach. J Allergy Clin Immunol. 2023;151:420–2. - PubMed
    1. Bao C, Liu C, Liu Q, Hua L, Hu J, Li Z, et al. Liproxstatin-1 alleviates LPS/IL-13-induced bronchial epithelial cell injury and neutrophilic asthma in mice by inhibiting ferroptosis. Int Immunopharmacol. 2022;109:108770. - PubMed
    1. Qian L, Mehrabi Nasab E, Athari SM, Athari SS. Mitochondria signaling pathways in allergic asthma. J Investig Med. 2022;70:863–82. - PMC - PubMed
    1. Morciano G, Naumova N, Koprowski P, Valente S, Sardão VA, Potes Y, et al. The mitochondrial permeability transition pore: an evolving concept critical for cell life and death. Biol Rev. 2021;96:2489–521. - PubMed

MeSH terms

Substances