. 2025 Jun 21;22(1):162.
doi: 10.1186/s12974-025-03489-1.

Targeting the RAGE-RIPK1 binding site attenuates diabetes-associated cognitive deficits

Affiliations

Targeting the RAGE-RIPK1 binding site attenuates diabetes-associated cognitive deficits

Lin Gao et al. J Neuroinflammation. .

Abstract

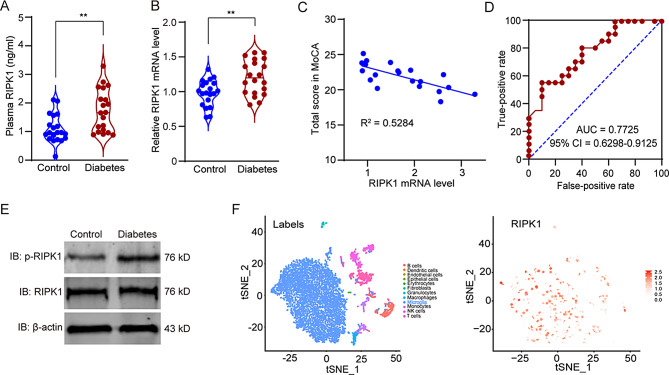
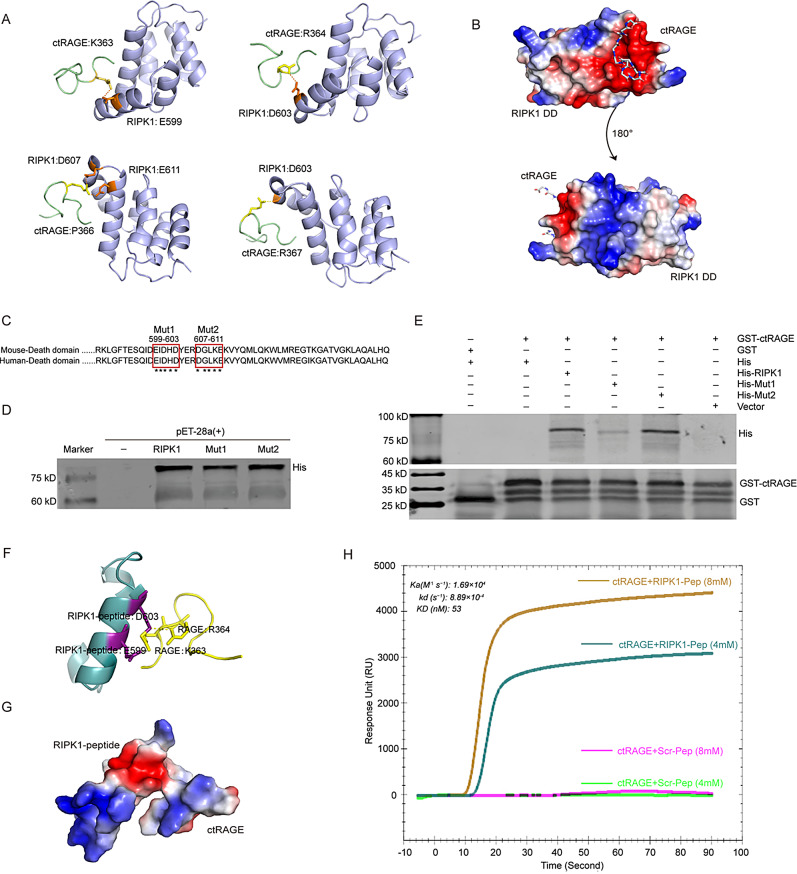
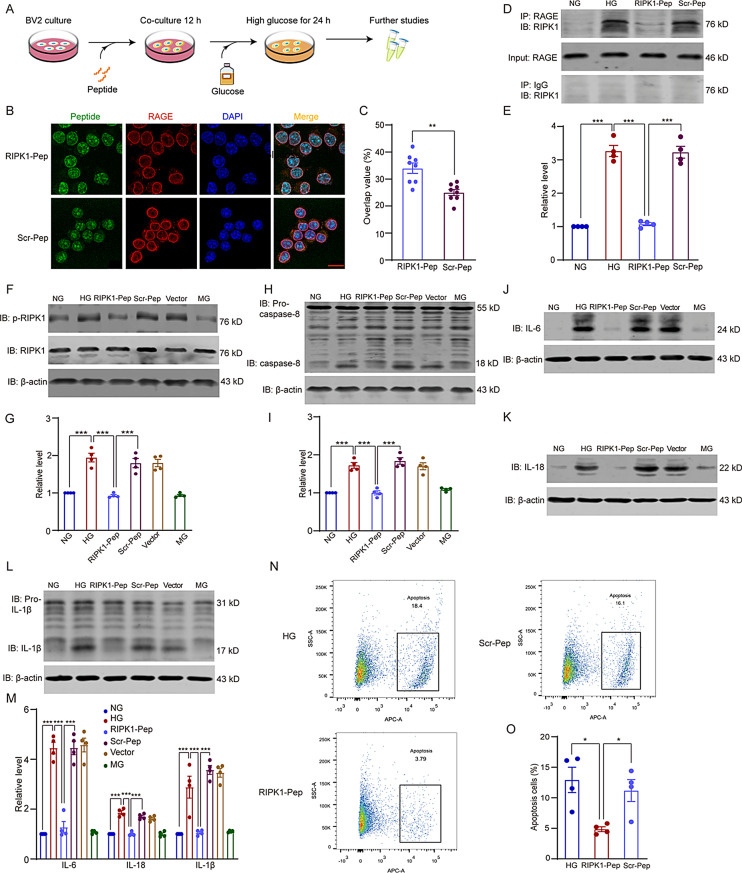
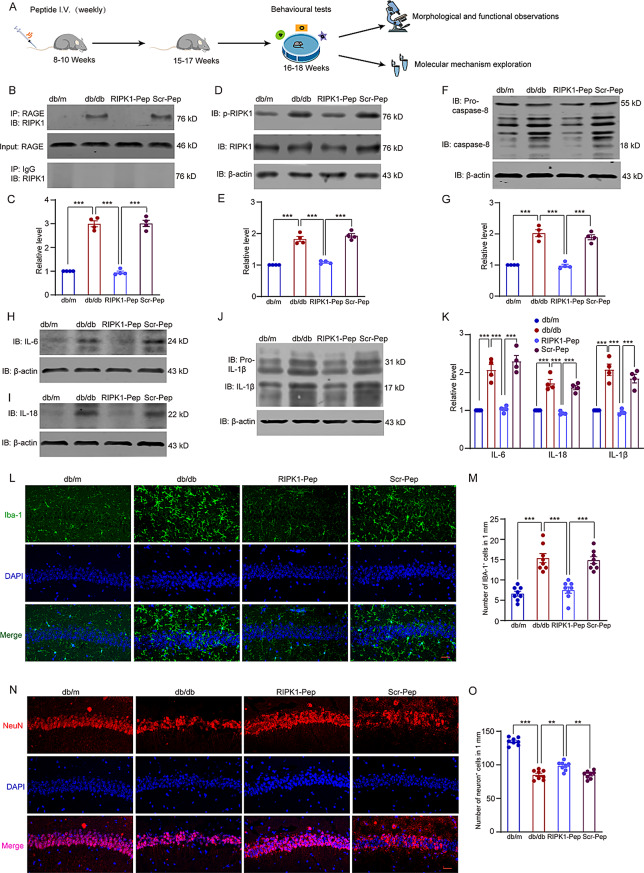
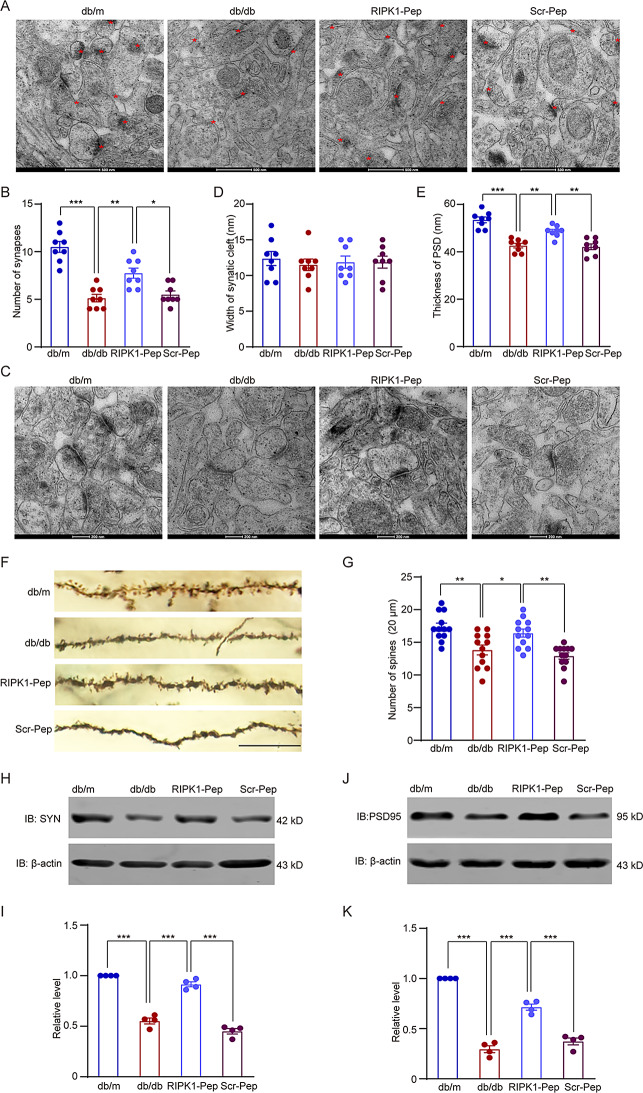
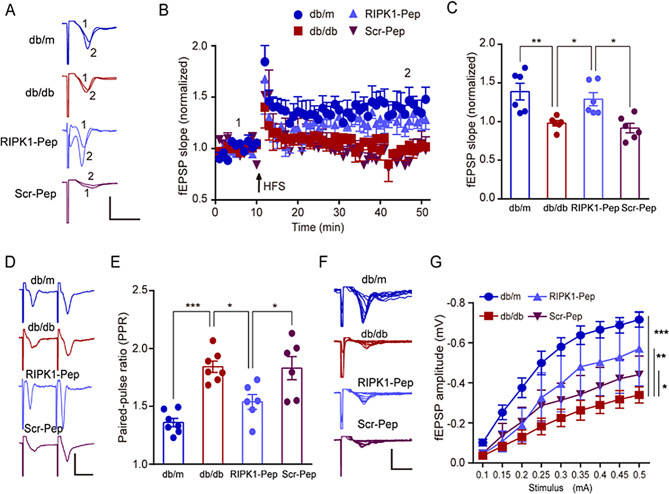
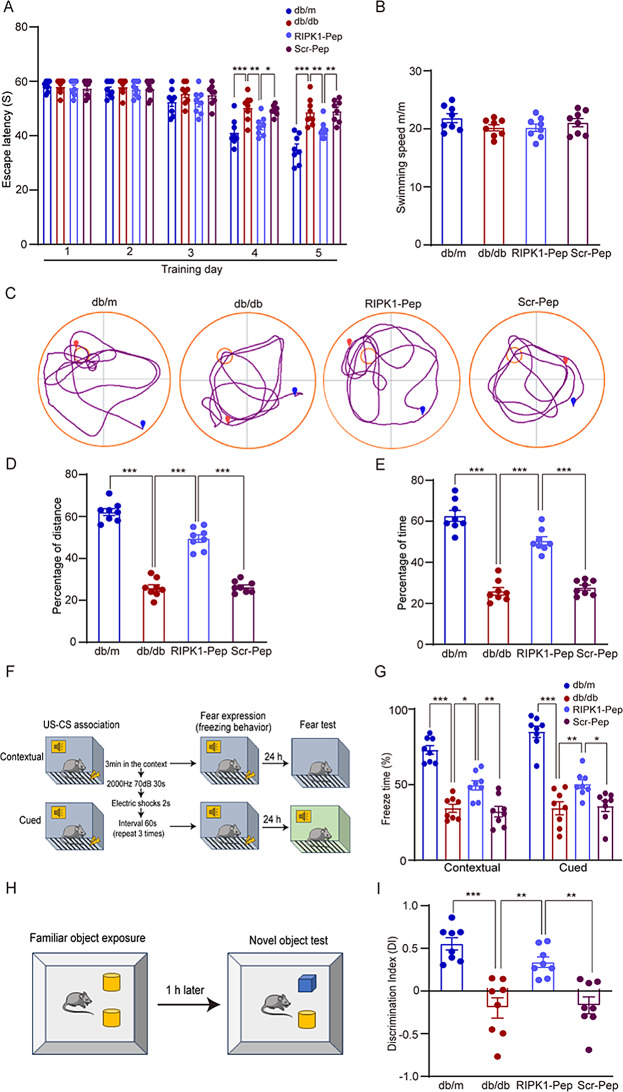
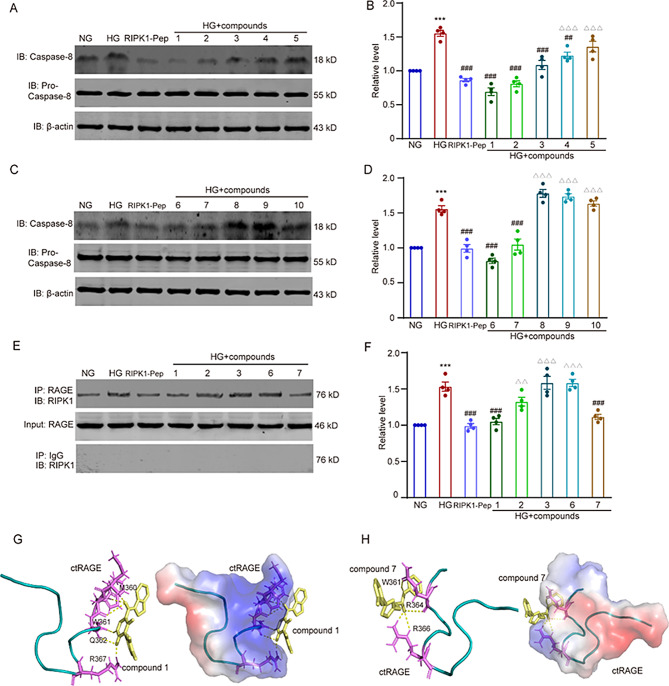
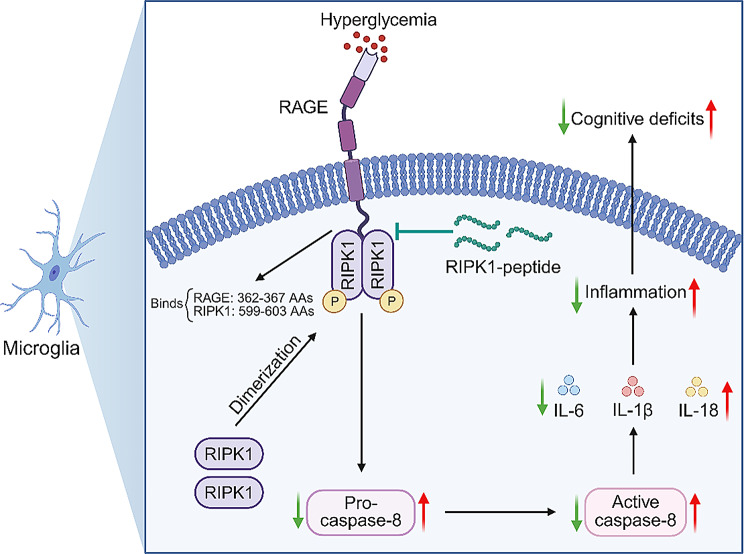
Microglial activation can cause neuroinflammation and the consequent neurological impairments play prominent roles in diabetes-associated cognitive deficits. Receptor-interacting protein kinase 1 (RIPK1) phosphorylation is involved in this deleterious microglial activation, but the exact molecular mechanisms are not clear. Here, RIPK1 expression was increased in diabetic patients with cognitive impairment. Furthermore, in diabetic mice, RIPK1 death domain directly binds to C-terminal of the receptor for advanced glycation end products (ctRAGE) could regulate RIPK1 phosphorylation in microglia. This RAGE-RIPK1 complex activates inflammatory signaling, resulting in cascades that ultimately promote cognitive impairment in diabetic mice. An engineered brain-targeting RIPK1 peptide blocked binding of RIPK1 to RAGE, which inhibited RIPK1 phosphorylation, decreased neuroinflammation, improved neuronal morphology and function, and prevented diabetes-associated cognitive deficits in mice. This study uncovers a previously unknown mechanism of neuroinflammation and suggests a novel therapeutic avenue for treating cognitive deficits induced by hyperglycemia.

Keywords: Diabetes-associated cognitive deficits; Neuroinflammation; RIPK1 peptide; Receptor-interacting protein kinase 1; The receptor for advanced glycation end products.


Conflict of interest statement

Declarations. Competing interests: The authors declare no competing interests.

Figures

Fig. 1
Fig. 1
RIPK1 levels are increased in diabetic patients and are associated with cognitive impairment. (A) Plasma RIPK1 levels in control and diabetic patients were measured with ELISA. n = 20 in each group. Data were analyzed with a t test, **p = 0.003. (B) RT-qPCR was used to validate the level of RIPK1 mRNA in the blood leukocytes. n = 20, and the p value (0.002) is based on an independent-samples t test. (C) Linear regression was used to assess the correlation between plasma RIPK1 levels and cognitive function in diabetic patients (n = 20). (D) An ROC curve was used to assess the diagnostic value of RIPK1 for diabetic patients with cognitive impairment. (E) Typical bands show the expression of RIPK1 and p-RIPK1 in the human brain (n = 1). (F) PanglaoDB (No: GSM3687219 in NCBI Database) was used for the RIPK1 single-cell RNA sequencing localization analysis in the brain. RIPK1 was expressed primarily in the microglial cluster
Fig. 2
Fig. 2
AAs 599–603 is the key site for binding of RIPK1 to ctRAGE. (A) Cartoon linear docking map showed spatial details of the interaction between the RIPK1 death domain (DD) and ctRAGE. The AAs 362–367 motif in ctRAGE is shown as sticks and the DD of RIPK1 is shown as bluish violet bands. The polar contact sites between RIPK1 and ctRAGE are represented by dotted lines. (B) Vacuum electrostatics map showing the DD of RIPK1 binding to ctRAGE. ctRAGE is labeled in sticks and colored by atom. Positively charged surfaces (blue), negatively charged surfaces (red), and neutral surfaces (white) are shown for the RIPK1 DD. A Swiss-model server and protein data bank (PDB) database were used to analyze the spatial structure of ctRAGE and the DD of RIPK1. The docking model was generated by Autodock Vina. The model figures representing protein interaction were drawn in PyMOL (version 3.0). (C) Homology of the DD of RIPK1 in human and in mouse. Two mouse mutant domains (Mut1: E599R/I600A/D601A/H602A/D603/A; Mut2: D607R/G608A/L609A/K610A/E611A) are displayed. * indicates completely homologous. (D) His-labeled pET-28(+)-RIPK1 and RIPK1 mutants (Mut1 and Mut2) were purified and overexpressed and were detected by immunoblotting with an anti-His antibody. (E) Mutation of AAs 599–603 significantly blocked the interaction between RIPK1 and RAGE. GST-tagged ctRAGE was expressed in BL21 cells and then subjected to GST pull-down analysis. RIPK1 and Mut2 (AAs 607–611 mutated) were pulled down by GST-tagged ctRAGE, but Mut1 could not bind to ctRAGE. (F) Molecular docking of the specific interfering peptide sequence of RIPK1 (based on AAs 599–603) with the AAs 362–367 motif of ctRAGE. ctRAGE is shown as yellow sticks and the interfering peptide sequence of RIPK1 is shown as dark green bands. The polar contact sites between the peptide and ctRAGE are represented by dotted lines. (G) Vacuum electrostatics map showing the RIPK1 interfering peptide sequence binding to ctRAGE. Positively charged surfaces (blue), negatively charged surfaces (red), and neutral surfaces (white) are shown for the complex. (H) SPR sensorgram for the RIPK1-peptide applied to ctRAGE immobilized on the CM5 sensor chip. The brown and dark green lines represent different concentrations of the RIPK1-peptide. The purple and green lines represent different concentrations of the scramble-peptide. All lines in the figure reflect the data after subtracting the blank chip control and solvent blank control
Fig. 3
Fig. 3
RIPK1-peptide alleviates the inflammatory response of microglia in a high-glucose environment by interrupting the RAGE–RIPK1 interaction. NG: normal glucose group (25 mM glucose); HG: high-glucose group (50 mM glucose); RIPK1-Pep: high-glucose group with 70 µM RIPK1-peptide in 0.9% saline; Scr-Pep: high-glucose group with 70 µM sramble-peptide in 0.9% saline; Vector: 0.9% saline control group; MG: mannitol control group (isosmotic pressure control, normal glucose group treated with 25 mM mannitol). (A) Schematic illustrating the timeline of the in vitro experiment. (B) RIPK1-peptide and RAGE co-localization in high glucose. After RIPK1-peptide and scramble-peptide were transfected, BV2 cells were subjected to high glucose and then immunofluorescence was used to detect the co-localization of peptides and RAGE. The RIPK1-peptide and scramble-peptide are labeled in green, RAGE is labeled in red, cellular nuclei are labeled in blue by DAPI. The co-localization of peptides and RAGE is shown in yellow, and the scale bar is 20 μm (magnification ×400). (C) Overlap values showing the co-localization of the peptides and RAGE. Data were analyzed with t tests, **p = 0.001. n = 8 in each group. (D and E) RIPK1-peptide blocked the co-precipitation of RAGE and RIPK1. The interaction of RAGE and RIPK1 was detected by co-IP followed by western blotting with RIPK1 antibody. Optical density was measured as the fold change relative to the NG group. Results were analyzed with a one-way ANOVA followed by Tukey’s test. F (3, 12) = 106.40. ***p < 0.001. n = 4 in each group. (F and G) The expression of p-RIPK1 in high-glucose conditions was detected by immunoblotting. Relative intensity is presented as the fold change relative to the NG group. Results were analyzed with a one-way ANOVA followed by Tukey’s test. F (5, 18) = 36.52. ***p < 0.001. n = 4. (H and I) Typical bands show the expression of caspase-8; the relative intensity is presented as the fold change to the NG group. Data were analyzed with a one-way ANOVA followed by Tukey’s test. F (5, 18) = 38.69. ***p < 0.001. n = 4. (J-M) Immunoblotting of IL-6, IL-18, and IL-1β relative to the NG group. Data are expressed as the means ± SEM, and the statistical analysis was calculated via one-way ANOVA followed by Tukey’s test. F (5, 18) = 79.54 (IL-6), 60.43 (IL-18), and 17.39 (IL-1β), respectively. ***p < 0.001. n = 4 in each group. (N) Example flow cytometry plots demonstrate gating for cellular apoptosis. The numerical value for each gate is the percent of apoptosis. (O) Apoptosis rate. A one-way ANOVA followed by Tukey’s test was used for the analysis. F (2, 9) = 7.03. *p = 0.015 (RIPK1-Pep vs. HG) and = 0.050 (Scr-Pep vs. RIPK1-Pep). n = 4 in each group
Fig. 4
Fig. 4
RIPK1-peptide protects hippocampal neurons against the inflammatory response in db/db mice by blocking the interaction between RAGE and RIPK1. db/m: age- and sex-matched normoglycemic heterozygous littermates; db/db: diabetic model group; RIPK1-Pep: db/db mice treated with the RIPK1-peptide (0.5 mg/kg, weekly); Scr-Pep: db/db mice treated with the scramble-peptide (0.5 mg/kg, weekly). (A) Schematic overview of the in vivo experimental design. (B) The interaction between RIPK1 and RAGE was tested with co-IP followed by western blotting with a RIPK1 antibody. (C) The intensity of RIPK1 pull-down by RAGE is shown as the fold change relative to the db/m group. Data were analyzed with a one-way ANOVA followed by Tukey’s test. F (3, 12) = 149.40. ***p < 0.001, n = 4 in each group. (D and E) Representative blots showing p-RIPK1 expression after RIPK1-peptide treatment. Relative optical densities are scramble as the fold change relative to the db/m group. One-way ANOVA and Tukey’s test. F (3, 12) = 80.95. ***p < 0.001. n = 4 in each group. (F and G) Typical blots showing caspase-8 expression in the hippocampus of db/db mice after RIPK1-peptide administration. Relative optical density is displayed as the fold change relative to the db/m group. One-way ANOVA and Tukey’s test. F (3, 12) = 59.55. ***p < 0.001. n = 4. (H-J) The expression of IL-6, IL-18, and IL-1β were assessed by immunoblotting with anti-IL-6, -IL-18, and -IL-1β antibodies, respectively. (K) Relative intensity is displayed as the fold change relative to the db/m group. Data were analyzed with a one-way ANOVA and Tukey’s test. F (3, 12) = 45.12 (IL-6), 46.59 (IL-18), and 35.58 (IL-1β), respectively. ***p < 0.001. n = 4 in each group. (L) Activated microglia in the hippocampal CA1 subregion were detected by immunofluorescence with an anti-Iba-1 antibody. Iba-1 is shown in green and cellular nuclei (DAPI) are shown in blue. Iba-1+ microglia were considered to be activated. Scale bar = 20 μm (magnification ×400). (M) The number of Iba-1+ microglia per 1-mm length was calculated. n = 4 in each group (two slices per mouse). Data were analyzed with a one-way ANOVA followed by Tukey’s test. F (3, 28) = 30.08. ***p < 0.001. (N) Surviving neurons in the hippocampal CA1 subarea were evaluated with immunofluorescence staining by anti-NeuN, and the number of neurons was evaluated as the number of surviving pyramidal neurons per 1-mm length. Scale bar = 20 μm (magnification ×400). (O) The overlap value was calculated. One-way ANOVA followed by Tukey’s test. F (3, 28) = 112.30. ***p < 0.001; **p = 0.001 (RIPK-Pep group vs. db/db group); **p = 0.002 (Scr-Pep group vs. RIPK-Pep group). n = 4 (two slices per mouse)
Fig. 5
Fig. 5
In hyperglycemic conditions, the RIPK1-peptide improves synaptic ultrastructure, synaptic plasticity, and synaptic proteins in the CA1 hippocampal subregion. (A) Representative transmission electron microscopy images of CA1 hippocampal subregion synapses in each group. Scale bar = 500 nm. (B) Quantitative analysis of hippocampal synapses in each group. Data were analyzed by a one-way ANOVA followed by Tukey’s test. F (3, 28) = 27.25. ***p < 0.001; **p = 0.003 (RIPK-Pep group vs. db/db group); *p = 0.012 (Scr-Pep group vs. RIPK-Pep group). n = 4 (two slices per mouse). (C) Typical images showing the synaptic cleft and the thickness of the PSD after RIPK1-peptide treatment. Scale bar = 200 nm. (D) Quantitative analysis of the width of the synaptic cleft. One-way ANOVA followed by Tukey’s test. F (3, 28) = 0.17. n = 8 synapses from 4 mice. (E) Quantitative analysis of PSD thickness after treatment with RIPK1-peptide. One-way ANOVA followed by Tukey’s test. F (3, 28) = 25.86. ***p < 0.001; **p = 0.002 (RIPK-Pep group vs. db/db group); **p = 0.001 (Scr-Pep group vs. RIPK-Pep group). n = 4 mice for each group. (F) Representative images showing dendritic spine density and morphology. Scale bar = 20 μm (magnification ×600). (G) The number of dendritic spines was counted in Image J, and data were analyzed with a one-way ANOVA followed by Tukey’s test. F (3, 44) = 11.17. **p = 0.002 (db/db group vs. db/m group; Scr-Pep group vs. RIPK-Pep group); *p = 0.027 (RIPK-Pep group vs. db/db group). n = 4 (three sections per mouse). (H-K) The expression of presynaptic protein synaptophysin (SYN) and postsynaptic protein PSD95 were measured by immunoblotting with the anti-synaptophysin and anti-PSD95 antibodies. Representative bands for synaptophysin and PSD95; fold change is relative to the db/m group. Data were analyzed with a one-way ANOVA followed by Tukey’s test. F (3, 12) = 127.60 (G) and 129.70 (I). ***p < 0.001. n = 4 mice per group
Fig. 6
Fig. 6
The RIPK1-peptide ameliorates impairments in synaptic plasticity in db/db mice. (A and B) Representative traces and time-course of fEPSP slopes during long-term potentiation (LTP) recordings. (C) RIPK1-peptide rescued the LTP fEPSP deficit in db/db mice. The relative decrease in fEPSP during the last 10 min of recording was analyzed with a one-way ANOVA followed by Tukey’s test. F (3, 20) = 4.22. **p = 0.004 (db/db group compared with db/m group); *p = 0.026 (RIPK1-Pep group vs. db/db group). *p = 0.013 (Scr-Pep group vs. RIPK1-Pep group). n = 6 from 3 mice per group. Scale bars represent 0.45 mV and 20 ms. (D) Representative traces from the paired-pulse ratio (PPR) experiment. (E) RIPK1-peptide rescued the PPR increments seen in db/db mice. Data were analyzed with a one-way ANOVA followed by Tukey’s test. F (3, 22) = 13.92. ***p < 0.001; *p = 0.015 (RIPK1-Pep group vs. db/db group); *p = 0.026 (Scr-Pep group vs. RIPK1-Pep group). n = 6 from 3 mice. Scale bars represent 0.3 mV and 25 ms. (F) Representative input–output traces. (G) RAGE mutation rescued the decrements in input–output curves for fEPSP amplitude seen in db/db mice. Data were analyzed with a two-way ANOVA followed by Sidak’s test. q (7, 189) = 0.82 (db/db group vs. db/m group), 0.30 (RIPK1-Pep group vs. db/db group), and 0.47 (Scr-Pep group vs. RIPK1-Pep group). ***p < 0.001; **p = 0.006; *p = 0.048. n = 6 slices from 3 mice
Fig. 7
Fig. 7
The RIPK1-peptide ameliorates cognitive deficits in db/db mice. (A) Average escape latency for four groups to reach the hidden platform in the Morris water maze on five consecutive training days. Data were analyzed with a two-way repeated-measures ANOVA followed by Sidak’s test. On the 4th day, q (8, 140) = 6.92 (db/db group vs. db/m group), 5.22 (RIPK1-Pep group vs. db/db group), and 4.36 (Scr-Pep group vs. RIPK1-Pep group). ***p < 0.001; **p = 0.002; *p = 0.0130. On the 5th day, q (8, 140) = 10.34 (db/db group vs. db/m group), 5.03 (RIPK1-Pep group vs. db/db group), and 5.31 (Scr-Pep group vs. RIPK1-Pep group). ***p < 0.001; **p = 0.003 (RIPK1-Pep group vs. db/db group) and 0.0014 (Scr-Pep group vs. RIPK1-Pep group). (B) Swimming speed was measured and analyzed with a one-way ANOVA followed by Tukey’s test. F (3, 28) = 1.46. n = 8 mice in each group. (C) Track photographs of the probe trial on the 6th day without the platform. (D and E) The ratio of distance and time spent in the target quadrant when the platform was not present and the number of the platform crossings during the probe trial were evaluated on the 6th day. Data were analyzed with a one-way ANOVA followed by Tukey’s test. F (3, 28) = 80.26 (D) and 76.37 (E), respectively. ***p < 0.001. n = 8 in each group. (F) Diagram illustrating the experimental protocol for the fear-conditioning test. (G) Percentage of time spent freezing in the contextual and cued fear conditioning trials. n = 8 in each group. Data were analyzed with one-way ANOVAs followed by Tukey’s test. F (4, 35) = 68.07 for contextual fear conditioning, ***p < 0.001; *p = 0.013; **p = 0.0033. F (3, 56) = 78.36 for cued fear conditioning. ***p < 0.001; **p = 0.008; *p = 0.018. (H) Schematic of the novel object recognition test. (I) Discrimination index. n = 8 mice in each group. Results were analyzed with a one-way ANOVA followed by Tukey’s test. F (3, 28) = 16.98. ***p < 0.001; **p = 0.002 (RIPK1-Pep group vs. db/db group) and 0.0026 (Scr-Pep group vs. RIPK1-Pep group)
Fig. 8
Fig. 8
Screening and initial validation of small molecules targeting the binding of RIPK1 to RAGE. HG + compounds (1–10): high-glucose group with the top 10 small molecules at 30 nmol/L. (A and C) Representative blots showing caspase-8 expression after treatment with the compound. (B and D) The intensity of caspase-8 is presented as the fold change relative to the NG group. Data were analyzed with one-way ANOVAs followed by Tukey’s test. In B, F (7, 24) = 32.98. ***p < 0.001 (HG vs. NG); !!!p < 0.001 (RIPK1-Pep and + compounds 1, 2 and 3 vs. HG); ##p = 0.002 (compounds 4 vs. HG); △△△p < 0.001 (compounds 4 and 5 vs. RIPK1-Pep). In D, F (7, 24) = 66.18. ***p < 0.001 (HG vs. NG); !!!p < 0.001 (RIPK1-Pep and + compounds 1, 2 and 3 vs. HG); △△△p < 0.001 (compounds 8, 9 and 10 vs. RIPK1-Pep). n = 4 in each group. (E and F) The interaction of RIPK1 and RAGE was detected with co-IP followed by western blotting with RIPK1 antibody. The optical densities of RIPK1 pulled down by RAGE are shown as the fold change relative to the NG group. Data were analyzed with one-way ANOVAs followed by Tukey’s test. F (7, 24) = 25.07 and n = 4 in each group. ***p < 0.001 (HG vs. NG); !!!p < 0.001 (RIPK1-Pep and + compounds 1 and 7 vs. HG); △△p = 0.003 (compound 2 vs. RIPK1-Pep); △△△p < 0.001 (compounds 3 and 6 vs. RIPK1-Pep). (G and H) Molecular docking and vacuum electrostatics map showing compounds 1 (G) and 7 (H) binding to ctRAGE. ctRAGE is shown as purple sticks and compounds 1 and 7 are shown in yellow. The polar contact sites between the small molecules and ctRAGE are represented by dotted lines
Fig. 9
Fig. 9
Summary of the main findings. In hippocampal microglia, hyperglycemia induces the direct binding of RIPK1 to ctRAGE through RIPK1 AAs 599–603. The RAGE–RIPK1 interaction is responsible for dimerization and phosphorylation of RIPK1 and activation of caspase-8, which leads to neuroinflammation and subsequent cognitive deficits. Our specific RIPK1-peptide alleviates inflammation-linked cognitive deficits by blocking the interaction between RIPK1 and RAGE in diabetes. This Figure was created in BioRender.com (Agreement number: HW28B93DPL)

Similar articles

References

    1. Cheng AYY, Gomes MB, Kalra S, Kengne AP, Mathieu C, Shaw JE. Applying the WHO global targets for diabetes mellitus. Nat Rev Endocrinol. 2023;19:194–200. - PubMed
    1. Sun H, Saeedi P, Karuranga S, Pinkepank M, Ogurtsova K, Duncan BB, et al. IDF diabetes atlas: global, regional and country-level diabetes prevalence estimates for 2021 and projections for 2045. Diabetes Res Clin Pract. 2022;183:109–19. - PMC - PubMed
    1. Nagayach A, Bhaskar R, Ghosh S, Singh KK, Han SS, Sinha JK. Advancing the Understanding of diabetic encephalopathy through unravelling pathogenesis and exploring future treatment perspectives. Ageing Res Rev. 2024;100:102450. - PubMed
    1. Yu MG, Gordin D, Fu J, Park K, Li Q, King GL. Protective factors and the pathogenesis of complications in diabetes. Endocr Rev. 2024;45:227–52. - PMC - PubMed
    1. Alonge KM, D’Alessio DA, Schwartz MW. Brain control of blood glucose levels: implications for the pathogenesis of type 2 diabetes. Diabetologia. 2021;64:5–14. - PMC - PubMed

MeSH terms

Substances

LinkOut - more resources