. 2025 Jun 21;23(1):693.
doi: 10.1186/s12967-025-06770-2.

Integrated peripheral blood multi-omics profiling identifies immune signatures predictive of neoadjuvant PD-1 blockade efficacy in head and neck squamous cell carcinoma

Affiliations

Integrated peripheral blood multi-omics profiling identifies immune signatures predictive of neoadjuvant PD-1 blockade efficacy in head and neck squamous cell carcinoma

Hao Zhang et al. J Transl Med. .

Abstract

Background: Neoadjuvant PD-1 inhibitor therapy has shown promise in locally advanced head and neck squamous cell carcinoma (HNSCC), but only a subset of patients achieves major pathological responses. Liquid biopsy, the analysis of tumor-derived biomarkers in readily accessible bodily fluids (primarily blood), offers significant advantages over traditional tissue biopsies for predicting cancer treatment outcomes. The aim of this study is to develop a predictive model for neoadjuvant PD-1 therapy response in HNSCC patients using exclusively liquid biopsy approaches-namely, peripheral blood immune profiling (CyTOF) and plasma cytokine panels (Olink).

Methods: In a prospective trial involving 50 HNSCC patients treated with neoadjuvant tislelizumab plus chemotherapy, peripheral blood samples were collected pre- and post-treatment. Immune cell subsets were analyzed by mass cytometry (CyTOF), and circulating protein markers were quantified via a 92-plex targeted proteomics panel (Olink). Multimodal features were integrated into a predictive model using logistic regression.

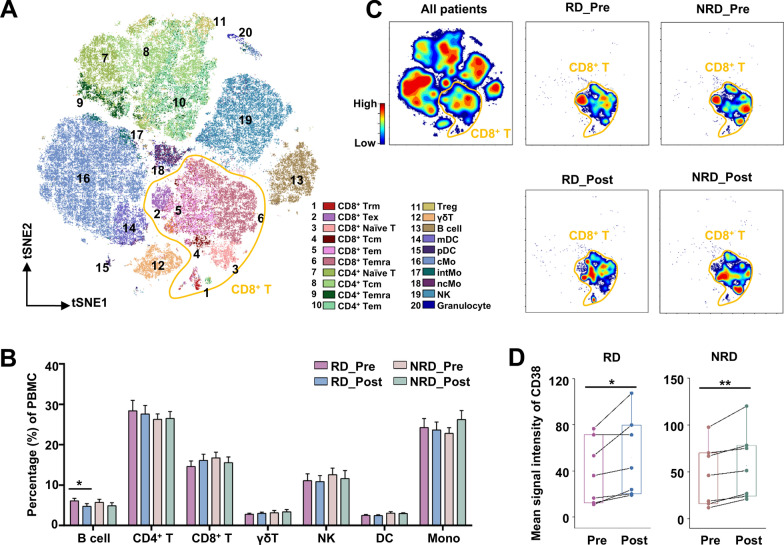
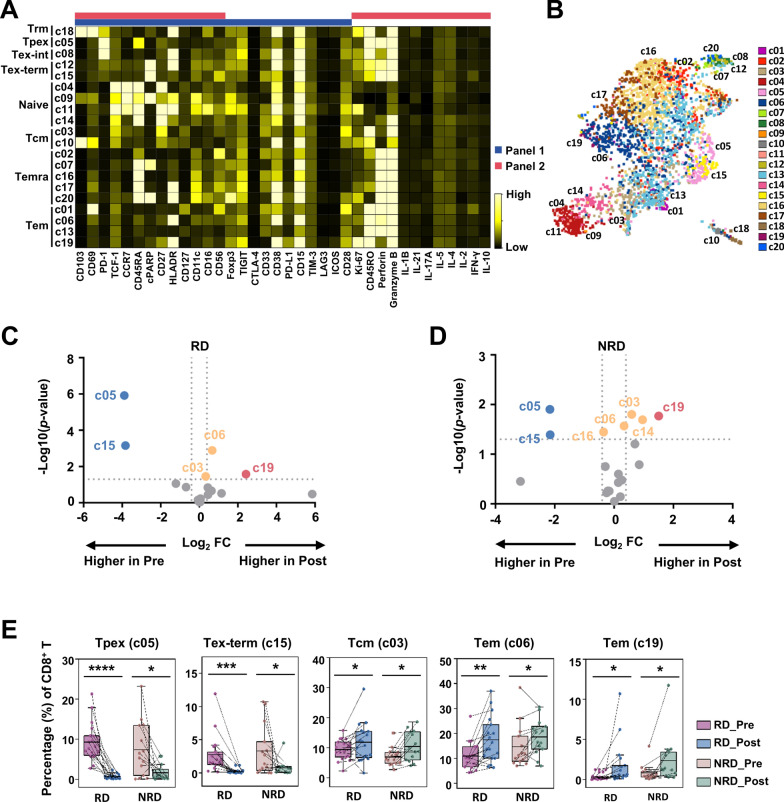
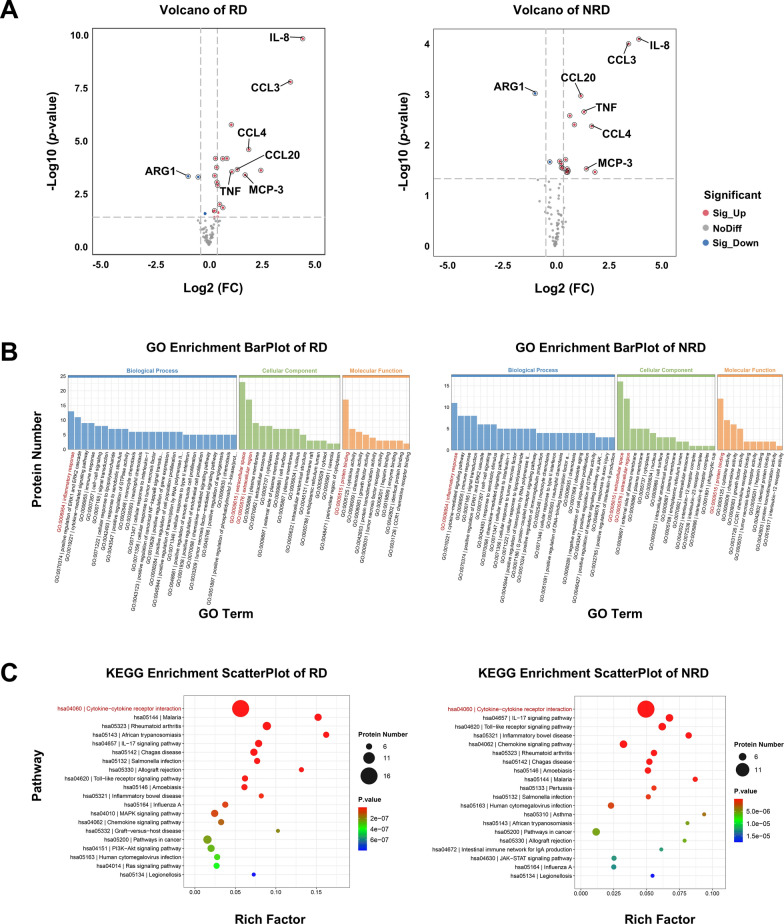
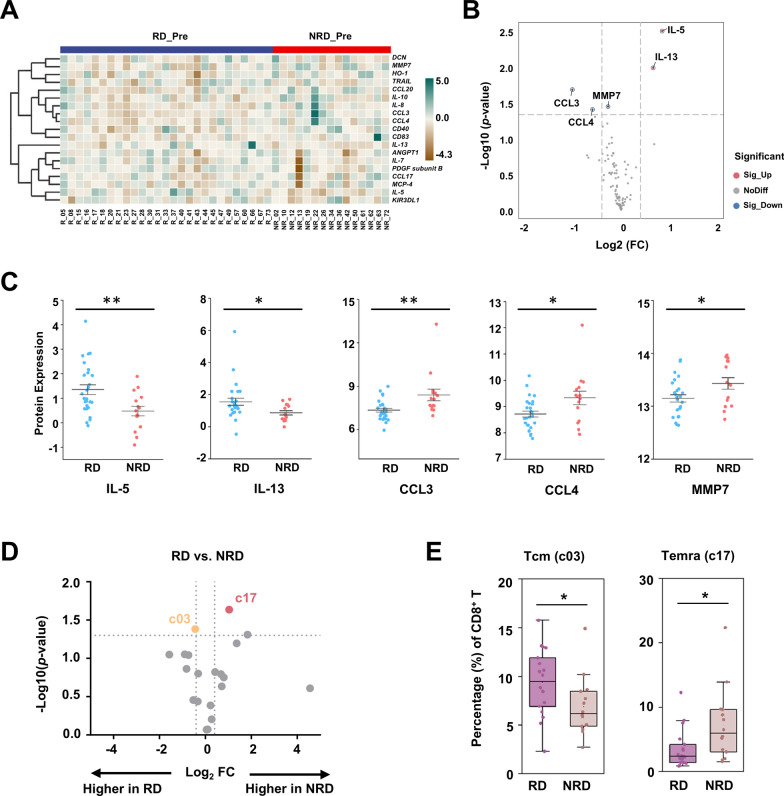
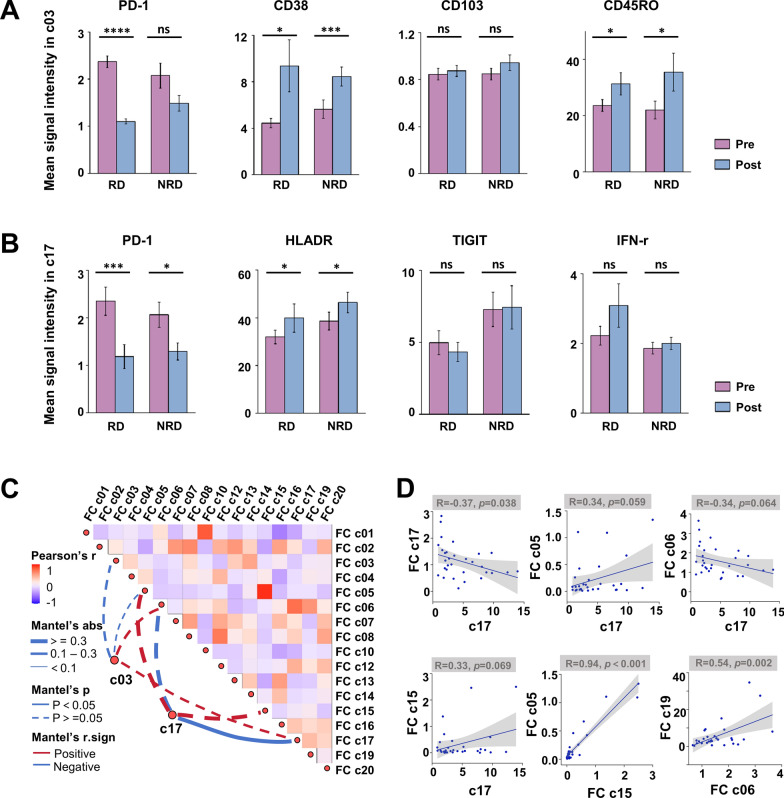
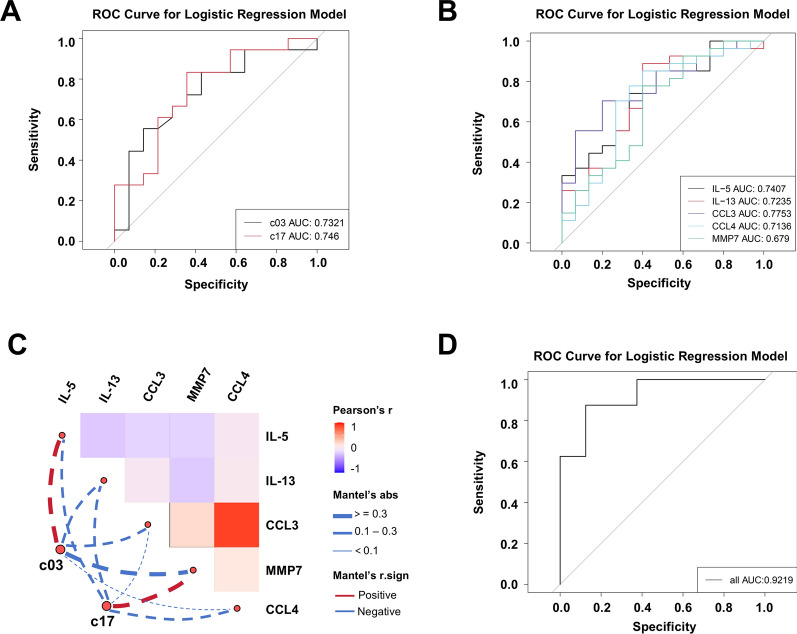
Results: Baseline immune profiles differed significantly between responder (RD) and non-responder (NRD): RD showed higher frequencies of CD103-CD8+ central memory T cells (Tcm, c03) and elevated plasma interleukins (IL-5, IL-13), whereas NRD had more CD28-TIGIThighcPARP-CD8+ terminally differentiated effector memory CD45RA+ T cells (Temra, c17) and higher levels of chemokines (CCL3, CCL4) and MMP7. Neoadjuvant therapy reactivated both subsets, evidenced by downregulation of PD-1 and increased expression of activation markers (e.g., CD38) and cytotoxic mediators (e.g., granzyme B and interferon γ). A multimodal predictive model incorporating CD8+T cell subsets (c03, c17) and plasma biomarkers (IL-5, MMP7) demonstrated superior predictive accuracy (AUC = 0.9219).

Conclusions: Integrated peripheral immune profiling enables robust, noninvasive prediction of neoadjuvant PD-1 blockade efficacy in HNSCC. The identified immune cell subsets and plasma biomarkers provide a clinically applicable framework for early response stratification and personalized immunotherapy, supporting liquid biopsy as a viable platform for clinical decision-making. Trial registration Chinese Clinical Trial Registry, clinical trial number CHiCTR2200056354, 04 February 2022, https://www.chictr.org.cn/showproj.html?proj=151364 .

Keywords: Head and neck squamous cell carcinoma; Liquid biopsy; Multi-omics research; Neoadjuvant therapy; PD-1 inhibitor.


Conflict of interest statement

Declarations. Ethics approval and consent to participate: The study was approved by the Ethics Committee of Peking University School and Hospital of Stomatology (No. PKUSSIRB-202170179 and No. PKUSSIRB-202276072). And written informed consent was obtained from all participants. Consent for publication: All the authors approved the publication. Competing interests: The authors declare that they have no competing interests.

Figures

Fig. 1
Fig. 1
Immunophenotypic Landscape of PBMCs in HNSCC. A t-SNE plot illustrating manual cluster annotation of major immune cell subsets in PBMCs. B Comparative frequencies of major PBMC immune subsets in RD (n = 18) and NRD (n = 14) groups pre- and post-neoadjuvant therapy. Data are presented as mean ± SEM. C Dual-axis density plots depicting immune subset distributions across PBMC populations; right panel highlights temporal dynamics of CD8+T cell density distributions in RD and NRD groups following neoadjuvant intervention. D Changes of CD38 expression (mean signal intensity) within PBMC immune subsets following neoadjuvant therapy in RD and NRD groups. Statistical significance was determined using paired t-tests B and D. *p < 0.05, **p < 0.01. PBMC peripheral blood mononuclear cells, HNSCC head and neck squamous cell carcinoma, RD responders, NRD non-responders, SEM standard error of the mean
Fig. 2
Fig. 2
Differential analysis of peripheral blood CD8+T cell clusters pre- versus post-neoadjuvant therapy. A Heatmap illustrating clustering and annotation of CD8+T cell clusters based on the mean expression levels of each marker. B UMAP plot depicting annotated CD8+T cell clusters. C, D Volcano plots demonstrating differential abundance analysis of CD8+T cell clusters pre- versus post-neoadjuvant therapy in RD and NRD groups. Red indicates clusters significantly increased after therapy, blue represents clusters significantly decreased after therapy, and orange denotes clusters with minor changes post-therapy. The vertical dashed lines at log2(FC) = − 0.58 and 0.58 correspond to fold change thresholds of 1.5-fold downregulation and upregulation, respectively. The horizontal dashed line at -log10(p-value) = 1.3 indicates the significance threshold (p = 0.05). E Frequency changes of cluster 03, 05, 06, 15, and 19 pre- versus post-neoadjuvant therapy in RD and NRD patient groups. Statistical analysis was performed using paired t-tests CE. *p < 0.05, **p < 0.01, ***p < 0.001, ****p < 0.0001. UMAP uniform manifold approximation and projection, RD responders, NRD non-responders, FC fold change
Fig. 3
Fig. 3
Differential expression and enrichment analysis of plasma immunooncological proteins pre- and post-neoadjuvant therapy. A Volcano plot analysis of differentially expressed immunooncological proteins pre- versus post-neoadjuvant therapy phases in RD and NRD groups. Red dots indicate significantly upregulated proteins; blue dots indicate significantly downregulated proteins; gray dots represent proteins without significant differential expression. The vertical dashed lines at log2(FC) = − 0.58 and 0.58 correspond to fold change thresholds of 1.5-fold downregulation and upregulation, respectively. The horizontal dashed line at -log10(p-value) = 1.3 indicates the significance threshold (p = 0.05). Statistical significance was determined by paired t-tests. B GO enrichment analysis of DEPs pre- versus post-neoadjuvant therapy in RD and NRD groups, categorized by biological processes, cellular components, and molecular functions. The x-axis represents enriched functional categories, while the y-axis shows the number of proteins enriched in the corresponding pathways. C KEGG enrichment analysis of DEPs identified pre- versus post-neoadjuvant therapy in RD and NRD groups. The vertical axis denotes enriched KEGG pathways, and the horizontal axis represents the ratio of the number of DEPs enriched in the current pathway to the total identified DEPs. The color gradient of bubbles indicates the significance levels of enrichment across different pathways. RD responders, NRD non-responders, FC fold change, GO gene ontology, DEPs differentially expressed proteins, KEGG kyoto encyclopedia of genes and genomes
Fig. 4
Fig. 4
Differential analysis of plasma proteins and peripheral blood CD8+T cell clusters in RD versus NRD groups pre-neoadjuvant therapy. A Heatmap depicting the expression of immunooncological plasma proteins in RD and NRD groups. B Volcano plot illustrating differential expression of 92 immunooncological proteins in RD versus NRD pre-neoadjuvant therapy. Red dots indicate significantly upregulated proteins, blue dots indicate significantly downregulated proteins, and gray dots represent proteins with no significant difference in expression. C Scatter plots of plasma proteins with the most significant differential expression between RD and NRD groups, including IL-5, IL-13, CCL3, CCL4, and MMP7. D Volcano plot demonstrating differential abundance analysis of CD8+T cell clusters between RD and NRD groups. Red dots indicate clusters significantly more abundant in the RD group, while orange dots indicate clusters enriched in the NRD group, and gray dots represent clusters with no significant difference. E Frequencies of CD8+Tcm (c03) and CD8+Temra (c17) in RD and NRD groups. The vertical dashed lines at log2(FC) = − 0.58 and 0.58 correspond to fold change thresholds of 1.5-fold downregulation and upregulation, respectively. The horizontal dashed line at -log10(p-value) = 1.3 indicates the significance threshold (p = 0.05). Statistical significance was determined by unpaired t-tests BE. *p < 0.05, **p < 0.01. RD responders, NRD non-responders, FC fold change
Fig. 5
Fig. 5
CD8+Tcm (c03) and CD8+Temra (c17) changes and interaction with other CD8+T cell clusters. A, B Expression changes of CD8+Tcm (c03) and CD8+Temra (c17) markers in RD and NRD groups following neoadjuvant therapy. C, D Network heatmap and scatter plots illustrating correlations between the abundance of CD8+Tcm (c03) and CD8+Temra (c17) pre-neoadjuvant therapy and the FC value of CD8+T cell clusters following therapy, with regression lines indicating significant covariation (Pearson's r). Statistical analysis was performed using paired t-tests A, B and D. *p < 0.05, **p < 0.01., ***p < 0.001, ****p < 0.0001. RD responders, NRD non-responders, FC fold changes
Fig. 6
Fig. 6
ROC analysis of CD8+T cell clusters and plasma proteins in RD and NRD groups. A Predictive capacity to classify neoadjuvant therapy RD of CD8+Tcm (c03) and CD8+Temra (c17). B Predictive capacity to classify neoadjuvant therapy RD of five differentially expressed proteins (IL-5, IL-13, CCL3, CCL4, MMP7). C Network heatmap depicting the interaction relationships between differential CD8+T cell clusters (c03 and c17) and differentially expressed proteins (IL-5, IL-13, CCL3, CCL4, MMP7). D Predictive capacity to classify neoadjuvant therapy RD of differentially cluster-protein combinations (c03, c17, IL-5 and MMP7). ROC Receiver operating characteristic, AUC area under the curve, RD responders, NRD non-responders

Similar articles

References

    1. Temilola DO, Adeola HA, Grobbelaar J, Chetty M. Liquid biopsy in head and neck cancer: its present state and future role in Africa. Cells. 2023. 10.3390/cells12222663. - PMC - PubMed
    1. Barsouk A, Aluru JS, Rawla P, Saginala K, Barsouk A. Epidemiology, risk factors, and prevention of head and neck squamous cell carcinoma. Med Sci. 2023. 10.3390/medsci11020042. - PMC - PubMed
    1. Vos JL, Elbers JBW, Krijgsman O, Traets JJH, Qiao X, van der Leun AM, Lubeck Y, Seignette IM, Smit LA, Willems SM, et al. Neoadjuvant immunotherapy with nivolumab and ipilimumab induces major pathological responses in patients with head and neck squamous cell carcinoma. Nat Commun. 2021;12:7348. - PMC - PubMed
    1. Liu L, Xiang Z, Li Y, Guo W, Yang K, Wang J, Sun Z, Ren G, Zhang J, Sun M, et al. The immune checkpoint inhibitors treatment of head and neck squamous cell carcinoma: an expert consensus. Hua Xi Kou Qiang Yi Xue Za Zhi. 2022;40:619–28. - PMC - PubMed
    1. Jubran MR, Vilenski D, Flashner-Abramson E, Shnaider E, Vasudevan S, Rubinstein AM, Meirovitz A, Sharon S, Polak D, Kravchenko-Balasha N. Overcoming resistance to EGFR monotherapy in HNSCC by identification and inhibition of individualized cancer processes. Theranostics. 2022;12:1204–19. - PMC - PubMed

MeSH terms