. 2025 Jun 23;10(1):195.
doi: 10.1038/s41392-025-02286-9.

Uncovering injury-specific proteomic signatures and neurodegenerative risks in single and repetitive traumatic brain injury

Affiliations

Uncovering injury-specific proteomic signatures and neurodegenerative risks in single and repetitive traumatic brain injury

Sarah Mantash et al. Signal Transduct Target Ther. .

Abstract

Traumatic brain injury (TBI) is a major public health concern associated with an increased risk of neurodegenerative diseases including Alzheimer's disease (AD), Parkinson's disease (PD), and chronic traumatic encephalopathy, yet the underlying molecular mechanisms in repetitive TBI remain poorly defined. This study investigates proteomic and behavioral changes following single and repetitive mild TBI in a mouse model, focusing on molecular alterations in the cortex and hippocampus across acute (48 h) and subacute (1 week) stages. Using shotgun proteomics and bioinformatics approaches, including weighted gene co-expression network analysis (WGCNA) and machine learning, we analyzed the proteomic landscapes of TBI-affected brain regions including the hippocampus and the cortex. We assessed motor and cognitive outcomes at 2-, 7-, and 30-days post-injury to explore functional impairments associated with observed molecular changes. Our findings reveal spatio-temporal injury- and time-specific proteomic changes, with a single TBI promoting neuroprotective and repair mechanisms, while repetitive TBI exacerbating neuronal damage and synaptic deficits in the hippocampus. Key deregulated proteins, including Apoa1, ApoE, Cox6a1, and Snca, were linked to neurodegenerative pathways, suggesting molecular connections between TBI and diseases like AD and PD. Behavioral assessments indicated that repetitive TBI significantly impaired motor and cognitive functions, with recovery in motor function by day 30, whereas cognitive deficits persisted. This study provides a detailed analysis of the proteomic and behavioral consequences of TBI, identifying molecular networks as potential biomarkers or therapeutic targets for mitigating long-term cognitive decline associated with repetitive head trauma. These findings underscore the importance of mitochondrial and synaptic integrity in TBI response and suggest that targeting these pathways could reduce neurodegenerative risk following repetitive TBI.


Conflict of interest statement

Competing interests: The authors declare no competing interests.

Figures

Fig. 1
Fig. 1
Unsupervised analysis of all proteins in the dataset. a, b Principal component analysis (PCA) shows the sample distribution along PC1 and PC2, which together account for ~35% of the total variance among samples. Left: Samples are colored by tissues. Right: Samples are colored by Hit-Time groups. c, d Unsupervised Machine learning using t-SNE algorithm
Fig. 2
Fig. 2
Heatmaps showing differentially-expressed proteins (DEPs) per tissue. DEPs were determined using a |log2(FC| > 1 and q < 0.05, comparing different Hit-Time groups to SHAM. In the heatmaps, red indicates high expression levels while blue represents low expression levels. Prior to clustering, the protein expression was centered and scaled. a Hierarchical clustering was conducted using Euclidean distance and average linkage to cluster the samples. Proteins were clustered using pearson correlation and average. More details about DEPs can be found in Supplementary Table 2. b Venn diagrams and heatmaps displaying the overlapped proteins that were deregulated in the hippocampus and cortex. Unique proteins in blue, red, or green, commonly altered proteins in the intersection of red, blue, and green. The Heat maps are based on the hierarchical clustering analysis corresponding to the detected proteins within the following conditions: sham, 1 hit, and 3 hits after 48 h or1 week post-injury taking the ipsilateral and contralateral hippocampus, and cortex regions (HI-I: Hippocampus 1 hit, HI-II: Hippocampus 3 hits, HC- I: Cortex 1 hit, HC-II: Hippocampus 3 hits). Distinct clusters are highlighted and assigned numbers from 1 to 7. Red corresponds to the upregulated proteins whereas green refers to the downregulated proteins. More details about the clusters can be found in Supplementary Table 3. c LDA plot and its classification report. Matrix confusion and classification report of LGBM model. Matrix confusion and classification report of the best and optimal model Ridge
Fig. 3
Fig. 3
Bubble plot showing enriched/depleted GO biological process (BP) terms for various comparisons. Columns represent conditions for which GO terms are enriched for DEPs that are either upregulated (right side) or downregulated (left side) compared to SHAM. Bubble size and color reflect odd-ration and gene number of genes, respectively. Terms with an adjusted p-value lower than 0.05 in at least one condition are displayed. Hippo: hippocampus; ipsi: ipsilateral; contra: contralateral. More details can be found in Supplementary Table 4
Fig. 4
Fig. 4
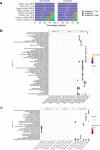
Analysis of differentially expressed proteins (DEPs) overlaps across time. a Barplot showing the intersections between 48 h and 1 week time points for the different hit conditions across tissues. For each condition: green color represents genes that are uniquely deregulated at 48 h compared to SHAM; purple color represents genes that are uniquely deregulated at 1 week compared to SHAM; while orange corresponds to genes that are shared between 48 h and 1 week time points. b, c Bubble plots showing enriched GO biological process (BP) terms for various conditions organized by time. Columns represent conditions for which GO terms are either enriched for DEPs that are unique to 48 h (left), 1 week (right) or shared between both time points (middle). Bubble size and color reflect odd-ration and gene number of genes, respectively. Only the terms with an adjusted p-value less than 0.05 in at least one condition are displayed. Hippo: hippocampus; ipsi: ipsilateral; contra: contralateral. More details can be found in Supplementary Tables 5 and 6
Fig. 5
Fig. 5
Analysis of differentially-expressed proteins (DEPs) overlap between hit conditions at specific time points. a Barplot showing the intersections between 1-hit and 3-hits conditions for 48 h and 1 week time-points across tissues. For each condition: green color represents genes that are uniquely deregulated at 48 h compared to SHAM; purple color represents genes that are uniquely deregulated at 1 week compared to SHAM; while orange corresponds to genes that are shared between 48 h and 1 week time points. b, c Bubble plots showing enriched GO biological process (BP) terms for various conditions organized by hit status. Columns represent conditions for which GO terms are either enriched for DEPs that are unique to 1-hit (left), 3-hits (right) or shared between both groups (middle). Bubble size and color reflect odd-ration and gene number of genes, respectively. Only terms displaying adjusted p value less than 0.05 in at least one condition are demonstrated. Hippo: hippocampus; ipsi: ipsilateral; contra: contralateral. More details can be found in supplementary Tables 7, 8, and 9
Fig. 6
Fig. 6
Identification of common patterns of DEPs across conditions. a heatmap showing all possible overlaps between up- and downregulated gene set across all conditions compared to SHAM. Rows and columns are annotated in blue and red colors to indicate up- and downregulation, respectively. Heatmap color reflects the number of overlapped genes, ranging from white (no overlap) to green and yellow, reflecting the increasing number of genes. Two clusters of constantly up- and downregulated genes across 3 tissues are highlighted in red and blue, respectively. Hippo: hippocampus; ipsi: ipsilateral; contra: contralateral. b Bubble plot showing enriched GO biological process (BP) terms enriched in DEPs shared across comparisons in the up- and downregulated clusters. Bubble size and color reflect odd-ratio and gene number of genes, respectively. The terms with an adjusted p < 0.05 in at least one condition are displayed. More details can be found in Supplementary Table 9
Fig. 7
Fig. 7
Weighted gene co-expression network analysis (WGCNA). a Topology overlap matrix displaying 10 modules that are shown with distinct colors. The gray color corresponds to a background module containing all proteins which were not associated with any other module. b Heatmap illustrating the module eigengenes (MEs) presenting the 9 modules of interconnected proteins. For every module, the eigengene corresponds to the first principal component (PC1) obtained from the PCA performed on the expression matrix of the associated genes. Hierarchical clustering for rows and columns was done using Euclidean distance with average linkage. Columns are annotated by tissues and experimental groups. Heatmap color is proportional to eigengene value (More details can be found in Supplementary Table 10)
Fig. 8
Fig. 8
Analysis of the brown module. a Boxplot demonstrating the changes in the brown module eigengene (MEbrown) across the SHAM, with the various Hit-Time conditions for each tissue. Student’s t-test was used to compare various conditions to SHAM. (*: p < 0.05; **: p < 0.01). b Heatmap showing the 405 proteins expression profile found in the brown module. c Scatter plot showing the correlation between Gene significance (GS) and Module membership. GS was described as the correlation of protein expression with 3-hits vs SHAM, regardless of tissue of origin. Module Membership (MM) corresponds to the correlation between protein expression and the module eigengene. The higher the GS score, the more a protein is increased by 3-hits compared to SHAM. The higher the MM score, the more a protein is interconnected within the module. A high positive correlation between GS and MM (r = 0.67, p = 4.3 × 10−54) demonstrates that the brown module constitutes an interconnected network of proteins that is increased by 3-hits. d GO biological process enrichment results for proteins found in the brown module. More details about enriched terms can be seen in Supplementary Fig. 6. e protein-protein interaction (PPI) network showing the top interconnected proteins within the brown module (weighted correlation > 0.1). The Node size and the edge width correspond to module membership (MM) and weighted correlation, respectively (the top 25% edges are only visualized). Hub proteins with an MM score above 0.9 are colored in brown. More details about brown-module proteins can be found in Supplementary Table 10
Fig. 9
Fig. 9
Analysis of the purple module. a Boxplot demonstrating the changes in the purple module eigengene (MEpurple) across the SHAM and various Hit-Time conditions for each tissue. Student’s t-test was used to compare various conditions to SHAM. (*: p < 0.05; **: p < 0.01). b Heatmap showing the expression profile of the 443 proteins found in the purple module. c Scatter plot showing the correlation between the Gene significance (GS) and the Module membership. GS was described as the correlation of protein expression with 3-hits vs SHAM, regardless of tissue of origin. Module Membership (MM) represents the correlation between the expression of the protein and the module eigengene. The lower the GS score, the more a protein is decreased by 3-hits compared to SHAM. The higher the MM score, the more a protein is interconnected within the module. High negative correlation between GS and MM (r = −0.59, p = 6.8 × 10−43) demonstrates that the purple module constitutes an interconnected network of proteins that is decreased by 3-hits. d GO biological process enrichment results for proteins found in the purple module. More details about enriched terms can be seen in Supplementary Fig. 8. e protein-protein interaction (PPI) network showing the top interconnected proteins in the purple module (weighted correlation > 0.1). The Node size and the edge width correspond to module membership (MM) and weighted correlation, respectively (only the top 25% edges are visualized). Hub proteins with an MM score above 0.9 are colored in purple. More details about purple-module proteins can be found in Supplementary Table 10
Fig. 10
Fig. 10
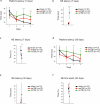
Assessment of motor function deficits. The pole climbing test for motor coordination (a) and the grip strength test for muscle strength (b) were conducted to assess gross motor function. The plots display mean climbing time (±CI) across 3 timepoints 2, 7, and 30 days after injury: Sham (black, n = 10), smTBI (red, n = 10), and rmTBI (green, n = 10). At day 2 post-injury (a), the smTBI (***p < 0.001) and rmTBI (*p < 0.05) groups took more time to descend the pole in comparison to sham, whereas at day 7 the rmTBI group took more time than sham (***p < 0.001) to descend, indicating more severe motor coordination deficits. At 30 days following injury, smTBI groups displayed mild impairments compared to the sham (**p < 0.01). In the grip strength test (b), the sham group performed better than both smTBI (***p < 0.001) and rmTBI (***p < 0.001) at days 2 and 7 post-injury. No significant differences were observed at day 30 in either test (p > 0.05). Statistical comparisons by linear mixed-effects models (LMM). Error bars (±95% CI) reflect the uncertainty of the mean estimate at each time point
Fig. 11
Fig. 11
Spatial learning and memory at subacute (7 days) and chronic (30 days) stages. Sham (black, n = 10), smTBI (red, n = 10), and rmTBI (green, n = 10). a Acquisition latencies in the Morris water maze in the sub-acute (day 7) Stage group; rmTBI mice took the longest time, significantly on acquisition days 3 (***p = 0.001) and 4 (***p < 0.001); smTBI group showed significant deficits on the fourth acquisition day (*p < 0.05) compared to the sham. b Probe trial NE quadrant latency (subacute); rmTBI required more time (***p < 0.001) than sham. c Probe trial % time in NE quadrant (subacute); rmTBI spent less time (**p < 0.01) than sham. df Chronic stage (day 30) analogs: (d) acquisition day 3 showed smTBI > sham (p < *0.05) and rmTBI > sham (**p < 0.01); acquisition day 4 showed rmTBI > sham (**p < 0.01); e probe latency showed rmTBI > sham (*p < 0.05), and (f) % time where rmTBI < sham (*p < 0.05), and no smTBI deficits were observed. Statistical comparisons by linear mixed-effects models (LMM). Error bars (±95% CI)
Fig. 12
Fig. 12
Assessment of anxiety-like behavior at the subacute and chronic time points. Anxiety-like behavior at subacute (7 days) and chronic (30 days) stages. Time spent in open (a) and closed (b) arms of the elevated plus maze. Sham (black, n = 10), smTBI (red, n = 10), and rmTBI (green, n = 10). All groups spent similar time, indicating no group differences in anxiety-like behavior. Statistical comparisons by linear mixed-effects models (LMM). Error bars (±95% CI); ns, not significant: p > 0.05

Similar articles

References

    1. Galgano, M. et al. Traumatic brain injury: current treatment strategies and future Endeavors. Cell Transplant.26, 1118–1130 (2017). - PMC - PubMed
    1. McKee, A. C. & Daneshvar, D. H. The neuropathology of traumatic brain injury. Handb. Clin. Neurol.127, 45–66 (2015). - PMC - PubMed
    1. Zheng, R. Z. et al. Neuroinflammation following traumatic brain injury: take it seriously or not. Front Immunol.13, 855701 (2022). - PMC - PubMed
    1. Jellinger, K. A. Traumatic brain injury as a risk factor for Alzheimer’s disease. J. Neurol. Neurosurg. Psychiatry75, 511–512 (2004). - PMC - PubMed
    1. Johnson, V. E., Stewart, W. & Smith, D. H. Traumatic brain injury and amyloid-beta pathology: a link to Alzheimer’s disease?. Nat. Rev. Neurosci.11, 361–370 (2010). - PMC - PubMed

MeSH terms