. 2025 Sep;24(9):e70141.
doi: 10.1111/acel.70141. Epub 2025 Jun 22.

Cell-Surface LAMP1 is a Senescence Marker in Aging and Idiopathic Pulmonary Fibrosis

Affiliations

Cell-Surface LAMP1 is a Senescence Marker in Aging and Idiopathic Pulmonary Fibrosis

Gabriel Meca-Laguna et al. Aging Cell. 2025 Sep.

Abstract

The accumulation of senescent cells (SEN) with aging produces a chronic inflammatory state that accelerates age-related diseases. Eliminating SEN has been shown to delay, prevent, and in some cases reverse aging in animal disease models and extend lifespan. There is thus an unmet clinical need to identify and target SEN while sparing healthy cells. Here, we show that Lysosomal-Associated Membrane Protein 1 (LAMP1) is a membrane-specific biomarker of cellular senescence. We have validated selective LAMP1 upregulation in SEN in human and mouse cells. Lamp1+ cells express high levels of the prototypical senescence markers p16, p21, Glb1, and have low Lmnb1 expression as compared to Lamp1- cells. The percentage of Lamp1+ cells is increased with age and in mice with fibrotic lungs due to bleomycin (BLM) instillation. The RNA-Sequencing analysis of the Lamp1-enriched populations in sham and BLM mice lung tissue revealed enrichment of several senescence-related genes in both groups when compared to the SenMayo gene set derived from transcriptomic profiling of senescence markers in Mayo Clinic research datasets. Finally, we use a dual antibody-drug conjugate (ADC) strategy to eliminate SEN in cell culture assay.

Keywords: ADC; LAMP1; aging; biomarker; senescence; surface.


Conflict of interest statement

A patent application related to the work described in this manuscript has been filed by the SENS Research Foundation (SRF), now operating as the Lifespan Research Institute (LRI), with A.S. listed as an inventor. All authors are or have been employees of SRF or LRI and have received salary support from these organizations. The authors declare no conflicts of interest.

Figures

FIGURE 1
FIGURE 1
Computational analysis of lysosomal‐associated proteins in senescent cells and old tissue. (a) Schematic of the proteomic screen of the plasma membrane of SEN. IMR‐90, SK‐MEL‐103, B16‐F10, and MEF cell lines were treated with doxorubicin, palbociclib, or nutlin to induce senescence and were collected for proteomic analysis (Marin et al. 2023). Created with BioRender.com. (b, c) Pathway enrichment analysis of proteins that were significantly upregulated on the surface of SEN in at least three conditions (Enrichr). (d) Distinct human muscle cells co‐expressing high (LogFC > 2) LAMP1 and CDKN1A (p21). (e–g) Correlation between LAMP1 expression and senescence‐associated markers (e) p21, (f) p16, and (g) BAX, BCL2‐associated X, apoptosis regulator, in healthy tissue (Correlation AnalyzeR).
FIGURE 2
FIGURE 2
LAMP1 is upregulated on the cellular membrane of senescent cells. (a) SA‐β‐Gal staining in IMR‐90 fibroblasts 9 days after treatment with doxorubicin. Scale bar = 150 μm. (b) Percentage of cells staining positive for SA‐β‐Gal; n = 3, unpaired t‐test; data represented as mean ± SEM. (c) Representative images of total LAMP1 staining in SEN doxorubicin‐treated fibroblasts and NS controls, n = 3. Red, LAMP1. Blue, Hoechst. Scale bar = 150 μm. (d‐i) LAMP1 expression on the surface of SEN and NS measured by flow cytometry. (d‐ii) LAMP1+ percentage of analyzed cells; n ≥ 3, unpaired t‐test. (d‐iii) Mean fluorescence intensity (MFI) of doxorubicin‐treated IMR‐90 fibroblasts stained for LAMP1, n ≥ 3, unpaired t‐test; data represented as mean ± SEM. (e) LAMP1+ cell proportion in senescent IMR‐90 cells at different time points after doxorubicin treatment. n = 2; data represented as mean ± SD. (f‐i) LAMP1 cell‐surface staining on IMR‐90 cells of increasing PD numbers; n = 2, data represented as gated cells (%). (f‐ii) Quantification of gated cells expressing LAMP1 on their cell surface with progressively higher population doubling number, n = 2; data represented as mean ± SD. (g) Representative image (n = 3 biological replicates) of etoposide‐treated fibroblasts stained with LAMP1 on the surface of SEN and NS. *p ≤ 0.05; ***p ≤ 0.001; ****p ≤ 0.0001.
FIGURE 3
FIGURE 3
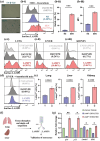
Lamp1+ cells express high levels of prototypical senescence markers in mouse tissues. (a) SA‐β‐Gal staining in MEFs 9 days after treatment with doxorubicin. Scale bar = 150 μm. (b‐i) Representative image of Lamp1 expression on the surface of SEN (red) and NS (blue) compared to isotype control (gray). Data is representative of n ≥ 3 biological replicates. (b‐ii) Quantification of gated cells expressing Lamp1 on their cell surface. Data is representative of n ≥ 3 biological replicates, unpaired t‐test; data represented as mean ± SEM. (b‐iii) MFI of SEN and NS stained with Lamp1. Data is representative of n ≥ 3 biological replicates, unpaired t‐test; data represented as mean ± SEM. (c) Lamp1+ population in the lungs (c‐i), liver (c‐ii), and kidneys (c‐iii) of middle‐aged mice (39–63 weeks old). Data is representative of n ≥ 2 biological replicates. (d) Representative flow cytometry gating strategy used to quantify Lamp1+ cells in the liver of 16‐week‐old mice. Cells were gated based on size, singlets, and viability, and compared to unstained and isotype controls. (e) Percentage of Lamp1+ cells in the liver, lungs, and kidneys of middle‐aged mice (39–63‐week‐old) compared to young (16‐week‐old). Data is representative of n ≥ 2 biological replicates. (f) Schematic of the experimental approach. Single cells were isolated from mouse tissue and sorted based on their Lamp1 status. RNA was isolated, and RT‐qPCR was used to validate prototypical markers of senescence. Created with BioRender.com. (g) Gene expression of p16, p21, Glb1, and Lmnb1 of Lamp1 and Lamp1+ cells. Unsorted single cells were used as controls (green). Data is representative of n ≥ 3 biological replicates, unpaired t‐test; data represented as mean ± SEM. Gapdh and Actb were used as housekeeping controls. *p ≤ 0.05; **p ≤ 0.01; ***p ≤ 0.001.
FIGURE 4
FIGURE 4
Mice with bleomycin‐induced pulmonary fibrosis have a higher percentage and diversity of Lamp1+ cells. (a) Schematic of the experimental design for the induction of fibrosis and senescence in mice. Bleomycin sulfate was delivered on day 0 using the oropharyngeal route of administration. After 24 days, the lungs were collected. Created with BioRender.com. (b) BLM‐induced weight loss. Weight is normalized to the day of BLM instillation (day 0), n = 6 (n = 3 saline‐treated mice; n = 3 BLM‐treated mice). (c‐i) Representative lung sections stained with Picrosirius red. Scale bar = 500 μm. (c‐ii) Quantification of collagen‐high areas (pixels) in controls and BLM‐treated mice (n = 3 saline‐treated mice; n = 3 BLM‐treated mice); data represented as mean ± SEM, unpaired t‐test. (d) Gene expression of Tgf‐β. Hprt was used as a housekeeping control, data represented as mean ± SEM, unpaired t‐test. (e‐i) Fold change increase of Lamp1+ cells in the lungs of BLM‐treated mice compared to saline controls. Data represented as mean ± SEM, unpaired t‐test. (e‐ii) Representative flow cytometry histogram of Lamp1 expression in saline‐treated controls and BLM‐treated fibrotic lungs. Data is representative of n ≥ 3 biological replicates. (f) Schematic of the experimental design for the induction of fibrosis and senescence in mice. Bleomycin sulfate was delivered on day 0 using the oropharyngeal route of administration. After 18–23 days, the lungs were collected to characterize cells expressing Lamp1. Mouse behavior was collected on day 17 (n = 7; n = 3 saline‐treated mice; n = 4 BLM‐treated mice). Created with BioRender.com. (g) Time spent on a rotarod (seconds) (n = 7; n = 3 saline‐treated mice; n = 4 BLM‐treated mice); data represented as mean ± SEM, unpaired t‐test. (h) Spontaneous movement was measured for 10 min during open field (n = 7; n = 3 saline‐treated mice; n = 4 BLM‐treated mice); data represented as mean ± SEM, unpaired t‐test. (i) Characterization of cells expressing surface Lamp1 in the BLM‐treated fibrotic pooled lungs and the saline‐treated mice pooled lungs. Data are representative of n = 3 saline‐treated mice and n = 4 BLM‐treated mice. (j) Representative flow cytometry histogram of Lamp1 expression in saline‐treated controls and BLM‐treated fibrotic lungs. Live, Cd45+, Cd11c+, and SiglecF cells were considered dendritic cells (DCs) (left panel). Live, Cd45+, Cd11c+, and SiglecF+ cells were considered macrophages (right panel). *p ≤ 0.05; **p ≤ 0.01.
FIGURE 5
FIGURE 5
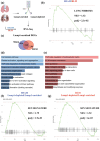
Lung Lamp1‐enriched cells have a senescent gene signature. (a) Schematic of the experimental design for the induction of fibrosis and senescence in mice. Bleomycin sulfate was delivered on day 0 using the oropharyngeal route of administration. After 21 days, the lungs were harvested, and whole‐tissue single cells were collected for sequencing. Additionally, cells were sorted based on surface Lamp1 expression and collected for sequencing. Created with BioRender.com. (b) GSEA of sham‐treated mice compared to BLM‐treated mice for the pathway “WP_LUNG_FIBROSIS.” (c) Upregulated genes in the Lamp1‐enriched samples in sham‐ (blue) and BLM‐treated (red) mice. Light pink represents genes upregulated in both sham and BLM when comparing Lamp1‐enriched versus Lamp1‐depleted cells. (d) Upregulated pathways in Lamp1‐enriched cells in the sham‐treated mice (BioPlanet 2019). All pathways had a padj < 0.05. Pathways on top had lower padj values. (e) Upregulated pathways in Lamp1‐enriched cells in the BLM‐treated mice (BioPlanet 2019). All pathways had a padj < 0.05. Pathways on top had lower padj values. (f, g) GSEA of sham‐treated mice and BLM‐treated mice for the pathway “SAUL_SEN_MAYO.” Lamp1‐depleted cells were compared to Lamp1‐enriched cells for (f) sham‐treated mice and (g) BLM‐treated mice.
FIGURE 6
FIGURE 6
A LAMP1‐ADC kills senescent cells. (a) LAMP1 expression on the surface of SEN and NS IMR‐90 at 4°C and 37°C. Data is representative of n ≥ 3 biological replicates. (b) Normalized cell index in SEN and NS IMR‐90 after 48 h of labeling with LAMP1 plus ADC, IgG control plus ADC, or nothing. Data is representative of n ≥ 3 biological replicates; mean ± SEM, unpaired t‐test. (c) Real‐time kinetics of ADC killing NS and SEN IMR‐90 as measured by the xCELLigence RTCA‐MP platform every 15 min. Untreated NS and SEN IMR‐90 were used as controls (0% death). Data is representative of n ≥ 3 biological replicates. (d) Cytotoxicity in SEN and NS IMR‐90 after 48 h of labeling with LAMP1 plus ADC, IgG control plus ADC, or nothing. Data is representative of n ≥ 3 biological replicates; mean ± SEM, unpaired t‐test. (e) ADC approach to target SEN while sparing healthy NS schematic. Created with BioRender.com. *p ≤ 0.05.

References

    1. Admasu, T. D. , Rae M., and Stolzing A.. 2021. “Dissecting Primary and Secondary Senescence to Enable New Senotherapeutic Strategies.” Ageing Research Reviews 70: 101412. 10.1016/j.arr.2021.101412. - DOI - PubMed
    1. Agarwal, A. K. , Srinivasan N., Godbole R., et al. 2015. “Role of Tumor Cell Surface Lysosome‐Associated Membrane Protein‐1 (LAMP1) and Its Associated Carbohydrates in Lung Metastasis.” Journal of Cancer Research and Clinical Oncology 141, no. 9: 1563–1574. 10.1007/s00432-015-1917-2. - DOI - PMC - PubMed
    1. Alessandrini, F. , Pezze L., and Ciribilli Y.. 2017. “LAMPs: Shedding Light on Cancer Biology.” Seminars in Oncology 44, no. 4: 239–253. 10.1053/j.seminoncol.2017.10.013. - DOI - PubMed
    1. Amor, C. , Fernandez‐Maestre I., Chowdhury S., et al. 2024. “Prophylactic and Long‐Lasting Efficacy of Senolytic CAR T Cells Against Age‐Related Metabolic Dysfunction.” Nature Aging 4, no. 3: 336–349. 10.1038/s43587-023-00560-5. - DOI - PMC - PubMed
    1. Amor, C. , Feucht J., Leibold J., et al. 2020. “Senolytic CAR T Cells Reverse Senescence‐Associated Pathologies.” Nature 583, no. 7814: 127–132. 10.1038/s41586-020-2403-9. - DOI - PMC - PubMed