. 2025 Jun 19:1-17.
doi: 10.1159/000546997. Online ahead of print.

Boundary Formation of the Human Caudal Foregut during the Early Fetal Period: Three-Dimensional Analysis Using T1-Weighted and Diffusion Tensor Images

Affiliations

Boundary Formation of the Human Caudal Foregut during the Early Fetal Period: Three-Dimensional Analysis Using T1-Weighted and Diffusion Tensor Images

Toru Kanahashi et al. Cells Tissues Organs. .

Abstract

Introduction: While caudal foregut development in human fetuses has been outlined in previous research, the formation of its border region remains unclear. This study aimed to visualize the precise timeline of caudal foregut boundary formation.

Methods: Three-dimensional images of the foregut from T1-weighted scans of 24 fetuses (crown-rump length [CRL]: 34-103 mm) were analyzed to measure the wall thickness and lumen diameter at nine specific sites. The internal structure in the border region was verified using histological sections and diffusion tensor imaging (DTI) tractography.

Results: The lower esophageal and pyloric canal walls were thicker in samples with a CRL ≥50 mm. The esophageal wall at the esophageal hiatus, where the lower esophageal sphincter is located, was particularly thick in samples with a CRL ≥88 mm. Increased wall thickness at the esophageal hiatus and pyloric canal resulted in a narrower lumen. The pyloric canal lumen narrowed from its distal to proximal sections. The lumen diameter-to-wall thickness ratio at the esophageal hiatus and proximal pyloric was negatively correlated with CRL. The thickened esophageal wall at the esophageal hiatus had a thick submucosa, and all layers in the pyloric canal thickened with growth. DTI tractography revealed that the lower esophageal wall mainly comprised longitudinal fibers, whereas the pyloric canal wall consisted solely of circular fibers, with fractional anisotropy increasing with growth.

Conclusion: This study provides a comprehensive timeline of normal caudal foregut boundary formation during the early human fetal period, thereby improving the understanding of congenital foregut obstruction pathogenesis.

Keywords: Boundary formation; Caudal foregut; Diffusion tensor imaging tractography; Human early fetal period; Three-dimensional analysis.


Conflict of interest statement

The authors have no conflicts of interest to declare. Shigehito Yamada was a member of the journal’s editorial board at the time of submission.

Figures
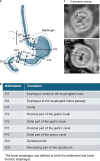
Fig. 1.
Fig. 1.
Wall thickness and lumen diameter measurements. a Nine measurement sites. b Description of the nine measurement sites. c The thickness of the three layers of the wall in the region of the lower esophageal and pyloric sphincters (ES2 and PY1) was measured. The layers are as follows: I, the inner layer with a high-intensity signal (including the luminal epithelium); M, the middle layer with a low-intensity signal (corresponding to the submucosa); and O, the outer layer with a high-intensity signal (including the adventitia and the muscularis propria).
Fig. 2.
Fig. 2.
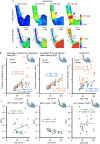
Growth of the foregut in the early fetal period. Representative ventral view of 3D reconstruction of the stomach. The thickness of the stomach is determined using surface thickness color mapping. The dotted line indicates the diaphragm. Black arrowheads indicate the thickening of the lower esophageal wall at the esophageal hiatus passage. White arrowheads indicate the thickening of the pyloric canal wall. The scale bar equals 2 mm. Li, liver; Pa, pancreas; Sp, spleen.
Fig. 3.
Fig. 3.
Growth of the lower esophagus in the early fetal period. a Representative ventral view of the reconstructed lower esophagus in fetuses (CRL: 34, 50, 88, 101 mm). The thickness of the lower esophagus is determined using surface thickness color mapping. Black arrowheads indicate thickening of the lower esophageal wall at the esophageal hiatus passage, whereas white arrowheads denote areas of localized luminal narrowing. The dotted line indicates the diaphragm, whereas the asterisk indicates the His angle. The scale bar equals 1 or 2 mm. b Maximum wall thickness and lumen diameter of the cranial aspect of the esophagus cranial to the esophageal hiatus (ES1), esophagus at the esophageal hiatus passage (ES2), and cardia (ST1). The blue circles indicate the maximum wall thickness. The orange circles indicate the maximum lumen diameter. c Lumen diameter-to-wall thickness ratio in ES1, ES2, and ST1. CRL, crown-rump length; R2, coefficient of determination.
Fig. 4.
Fig. 4.
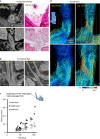
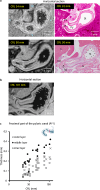
Internal structure of the caudal foregut wall at the border of the lower esophagus and stomach. a Representative MR image and histological horizontal sections of the lower esophagus in fetuses (CRL: 32, 34, and 50 mm). b Representative MR image of coronal sections of the lower esophagus in fetuses (CRL: 50 and 101 mm). The red arrowhead indicates the thickening of the esophageal wall at the esophageal hiatus passage. Note the particularly increased thickness of the layer corresponding to the submucosa of the esophageal wall at the esophageal hiatus in the fetus with CRL of 101 mm. The scale bar equals 1 or 2 mm. c Thickness of the inner layer, middle layer, and outer layer at ES2. The white circles, black circles, and crosses indicate the thicknesses of the inner, middle, and outer layers, respectively. d The gross (top) and close-up (bottom) dorsal views of DTI tractography showing the orientation of fibers in the lower esophageal wall from the dorsal view (CRL: 50 and 101 mm). Fiber tracts are visualized according to the FA code. Orange squares are shown in the image (top). The illustration shows the fibers in the esophageal hiatus (white ring) along with the fibers in the esophageal wall. The esophageal hiatus was located between the 8th thoracic vertebrae. Ao, aorta; D, dorsal side; Di, diaphragm; Es, esophagus; Li, liver; Lu, lung; St, stomach; V, ventral side.
Fig. 5.
Fig. 5.
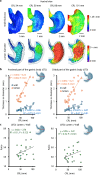
Growth of the gastric body in the early fetal period. a Representative ventral view of the reconstructed stomach in fetuses (CRL: 34, 50, 88, 101 mm). The thickness of the stomach is determined using surface thickness color mapping. The scale bar equals 1 or 2 mm. b Maximum wall thickness and lumen diameter of the proximal (ST2) and distal gastric body (ST3). The blue circles indicate the maximum wall thickness. The orange circles indicate the maximum lumen diameter. c Lumen diameter-to-wall thickness ratio in ST2 and ST3. CRL, crown-rump length; R2, coefficient of determination.
Fig. 6.
Fig. 6.
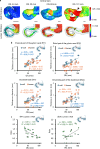
Growth of the pyloric canal, duodenum bulb, and descending part of the duodenum in the early fetal period. a Representative ventral view of the reconstructed pyloric canal, duodenum bulb, and descending part of the duodenum in fetuses (CRL: 34, 50, 88, 101 mm). The thickness of the pyloric canal, duodenum bulb, and descending part of the duodenum is determined using surface thickness color mapping. Black arrowheads indicate areas of localized wall narrowing. The white arrowhead indicates an area of luminal narrowing in the superior duodenum. The scale bar equals 2 mm. b Maximum wall thickness and lumen diameter of the proximal part of the pyloric canal (PY1), distal part of the pyloric canal (PY2), duodenum bulb (DU1), and descending part of the duodenum (DU2). The blue circles indicate the maximum wall thickness. The orange circles indicate the maximum lumen diameter. c Lumen diameter-to-wall thickness ratio in PY1 and DU1. CRL, crown-rump length; R2, coefficient of determination.
Fig. 7.
Fig. 7.
Internal structure of the caudal foregut wall at the border of the pylorus and duodenal bulb. a Representative MR image and histological horizontal sections of the border between the pylorus and the duodenal bulb in fetuses (CRL: 32, 34, and 50 mm). b Representative horizontal MR image section of the border between the pylorus and the duodenal bulb (CRL: 101 mm). c Thickness of the inner layer, middle layer, and outer layer at PY1. The white circles, black circles, and crosses indicate the thicknesses of the inner, middle, and outer layers, respectively. The scale bar equals 1 or 2 mm. Asterisks indicate gastric folds. Cf, circular folds; D, dorsal side; Du, duodenum; Je, jejunum; L, left; Li, liver; Pa, pancreas; Py, pyloric canal; R, right; St, stomach; V, ventral side.
Fig. 8.
Fig. 8.
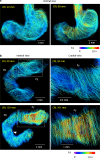
DTI tractography of the stomach and duodenum. a DTI tractography showing the orientation of fibers in the gastric and duodenal wall from the ventral view (CRL: 46 and 88 mm). b Gross image (left) of the DTI tractography from the ventral view of the pyloric canal, duodenal bulb, and descending part of the duodenum and a close-up (right) of the pyloric canal from the cranial view. White squares are shown in the images on the left. The white arrowhead indicates major duodenal papilla. Fiber tracts are visualized according to the FA code. The scale bar equals 0.5, 1, or 2 mm. Du, duodenum; Py, pyloric canal.

Similar articles

References

    1. O’Rahilly R. The timing and sequence of events in the development of the human digestive system and associated structures during the embryonic period proper. Anat Embryol. 1978;153(2):123–36. - PubMed
    1. Bourdelat D, Barbet JP, Chevrel JP. Fetal development of the pyloric muscle. Surg Radiol Anat. 1992;14(3):223–6. - PubMed
    1. Malinger G, Levine A, Rotmensch S. The fetal esophagus: anatomical and physiological ultrasonographic characterization using a high-resolution linear transducer. Ultrasound Obstet Gynecol. 2004;24(5):500–5. - PubMed
    1. Koyuncu E, Malas MA, Albay S, Cankara N, Karahan N. The development of fetal pylorus during the fetal period. Surg Radiol Anat. 2009;31(5):335–41. - PubMed
    1. Ernst LM, Ruchelli ED, Huff DS. Chapter 3. Color atlas of fetal and neonatal histology. In: Ernst LM, Ruchelli ED, Huff DS, editors. Gastrointestinal tract. Berlin: Springer Science and Business Media; 2011. p. 39–65.