. 2025 Jul 1;97(25):13628-13636.
doi: 10.1021/acs.analchem.5c02232. Epub 2025 Jun 23.

A Microfluidic Device to Realize Electrochemically Controlled SERS Detection in HPLC

Affiliations

A Microfluidic Device to Realize Electrochemically Controlled SERS Detection in HPLC

Maximilian E Blaha et al. Anal Chem. .

Abstract

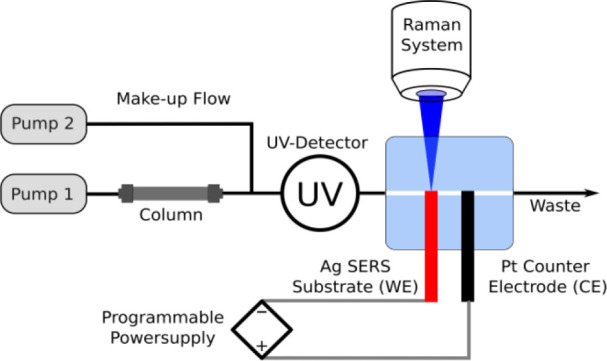
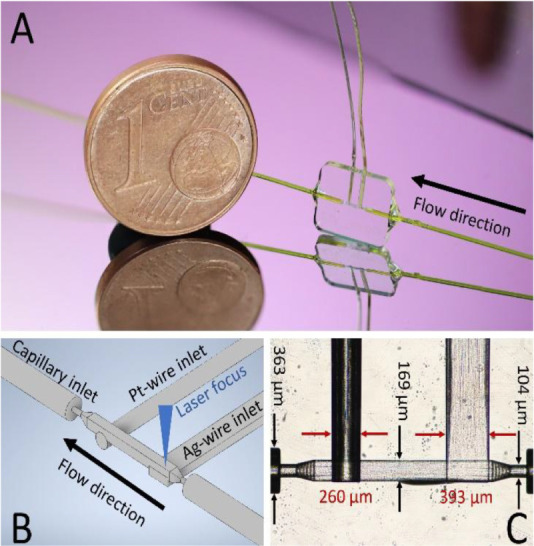
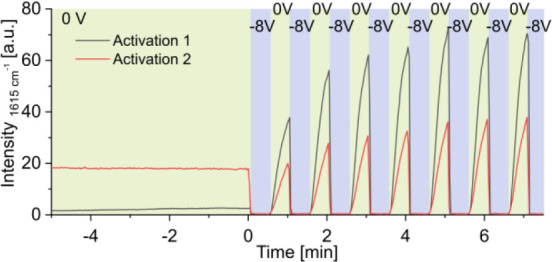
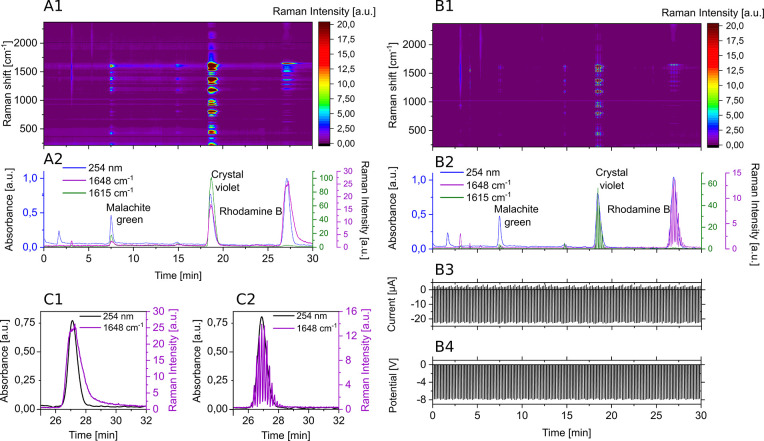
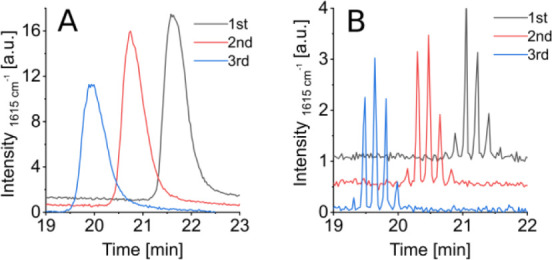
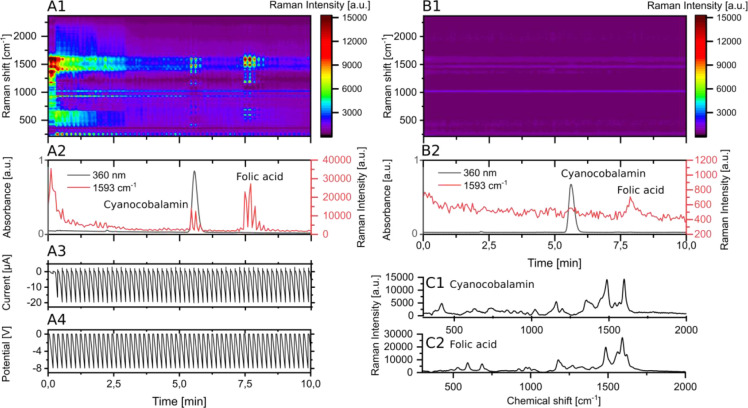
Surface-enhanced Raman spectroscopy (SERS) is a powerful technique for vibrational spectroscopy, but analyzing mixtures in solution remains challenging due to spectral overlap. Integrating SERS with a separation method, such as high-performance liquid chromatography (HPLC), offers a promising solution. However, online coupling has been limited by the compatibility issues between the SERS process and flow-based systems, which can result in either irreversible analyte adsorption on the SERS substrate or insufficient interaction. This can lead to signal carry-over or low sensitivity. In this study, we present the first HPLC-compatible, pressure-stable SERS flow cell designed for real-time analysis under continuous flow. Fabricated entirely from glass using selective laser etching, the monolithic flow cell incorporates a silver-based SERS substrate and a counter electrode, enabling online electrochemical SERS (EC-SERS) experiments. Electrochemical control facilitates on-demand substrate activation, thereby enhancing signal intensity, extending substrate lifetime, and eliminating memory effects. This approach broadens the range of detectable analytes, including those that are traditionally difficult to detect using passive SERS. We demonstrate the performance of the system through HPLC-SERS analyses of model dyes (e.g., crystal violet, malachite green, and rhodamine) and pharmaceutical compounds (e.g., cyanocobalamin and folic acid). This innovation introduces a novel SERS-based HPLC detection method, supporting the seamless integration of SERS into high-throughput analytical workflows.


Figures

1
1
Experimental setup.
2
2
(A) Flow sensor next to a coin for size comparison. (B) Schematic sketch of the glass body indicating inlets for the materials and the future focus spot. (C) Microscopic photograph of the glass body indicating the dimensions.
3
3
Initial SERS substrate activation of two different sessions. Signal progression of crystal violet over time. 10 μM crystal violet dissolved in 35/75 MeOH/H2O at 1615 cm–1.
4
4
(A) Separation of malachite green, crystal violet, and rhodamine B without applied potentials. (A1) Full Raman spectrum progression over time. (A2) Progression of the UV absorbance and selected Raman band intensities as indicated over time. (B) Separation of malachite green, crystal violet, and rhodamine B with applied potentials (8 s 0.0 V; 2 s from 0.0 V to −8.0 V). (B1) Full Raman spectrum progression over time. (B2) Progression of the UV absorbance and selected Raman band intensities as indicated over time. (B3) Measured current over time. (B4) Measured potential over time. (C) Comparison of Raman signal tailing of rhodamine B between measurements without (C1) and with applied potential program (C2). Raman settings for all measurements: 1 s integration time; 2.5 mW laser power.
5
5
Repeated measurements of crystal violet under HPLC conditions in consecutive runs. (A) Without potential program. (B) With underlying potential program (8 s 0.0 V; 2 s from 0.0 V to −8.0 V). Sample: 100 μL of 10 μM crystal violet dissolved in 35/75 MeOH/H2O at 1615 cm–1. Raman settings: 1s integration time; laser power: 5 mW.
6
6
(A) Separation of cyanocobalamin and folic acid with applied potentials (2 s 0.0 V; 8 s from 0.0 V to −8.0 V). (A1) Full Raman spectrum progression over time. (A2) Progression of the UV absorbance and selected Raman band intensities as indicated over time. (A3) Measured current over time. (A4) Measured potential over time. (B) Separation of cyanocobalamin and folic acid without applied potentials. (B1) Full Raman spectrum progression over time without applied potentials. (B2) Progression of the UV absorbance and selected Raman band intensities as indicated over time without applied potentials. (C) Extracted Raman spectra of cyanocobalamin (C1) extracted from (A1) and folic acid (C2) extracted from (A1). Raman settings for all measurements: 3 × 1 s integration time; 6.3 mW laser power.

Similar articles

References

    1. Han X. X., Rodriguez R. S., Haynes C. L., Ozaki Y., Zhao B.. Surface-enhanced Raman spectroscopy. Nat. Rev. Methods Primers. 2021;1:87. doi: 10.1038/s43586-021-00083-6. - DOI
    1. Li C., Huang Y., Li X., Zhang Y., Chen Q., Ye Z., Alqarni Z., Bell S. E. J., Xu Y.. J. Mater. Chem. C. 2021;9:11517. doi: 10.1039/D1TC02134F. - DOI
    1. Pilot R., Signorini R., Durante C., Orian L., Bhamidipati M., Fabris L.. A Review on Surface-Enhanced Raman Scattering. Biosensors. 2019;9:57. doi: 10.3390/bios9020057. - DOI - PMC - PubMed
    1. Itoh N., Bell S. E. J.. High dilution surface-enhanced Raman spectroscopy for rapid determination of nicotine in e-liquids for electronic cigarettes. Analyst. 2017;142:994. doi: 10.1039/C6AN02286C. - DOI - PubMed
    1. Yang S., Dai X., Stogin B. B., Wong T.-S.. Ultrasensitive surface-enhanced Raman scattering detection in common fluids. Proc. Natl. Acad. Sci. U. S. A. 2016;113:268. doi: 10.1073/pnas.1518980113. - DOI - PMC - PubMed

LinkOut - more resources