. 2025 Jul 1;131(13):e35897.
doi: 10.1002/cncr.35897.

Mitochondrial proteome landscape unveils key insights into melanoma severity and treatment strategies

Affiliations

Mitochondrial proteome landscape unveils key insights into melanoma severity and treatment strategies

Yonghyo Kim et al. Cancer. .

Abstract

Background: Melanoma, the deadliest form of skin cancer, exhibits resistance to conventional therapies, particularly in advanced and metastatic stages. Mitochondrial pathways, including oxidative phosphorylation and mitochondrial translation, have emerged as critical drivers of melanoma progression and therapy resistance. This study investigates the mitochondrial proteome in melanoma to uncover novel therapeutic vulnerabilities.

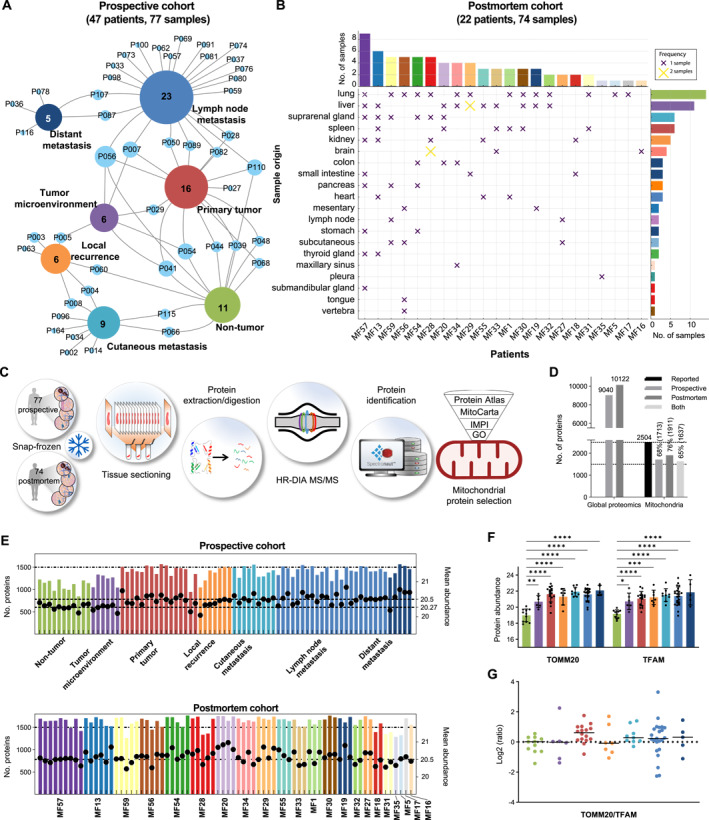
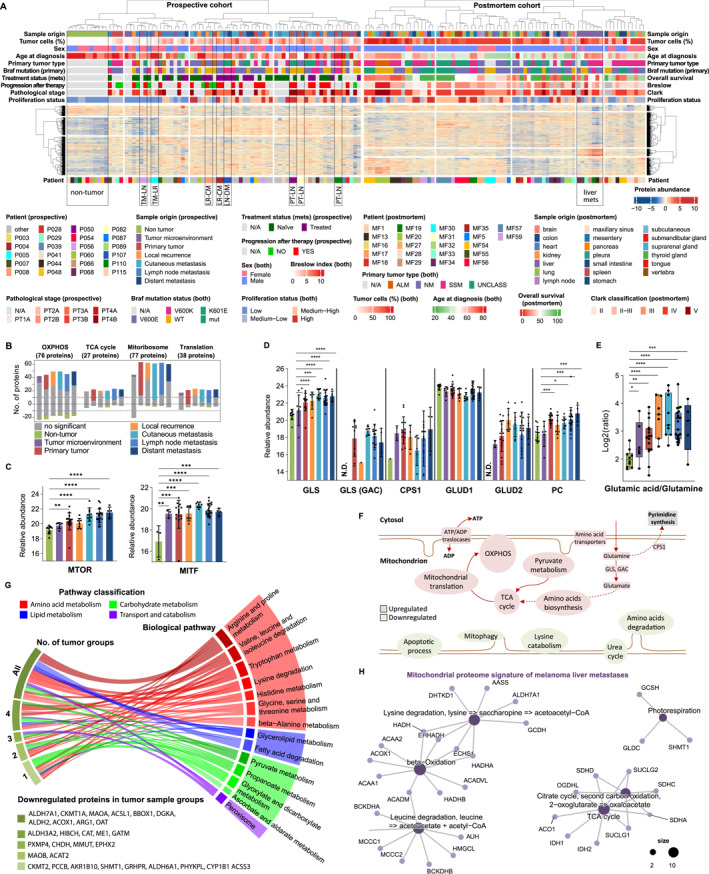
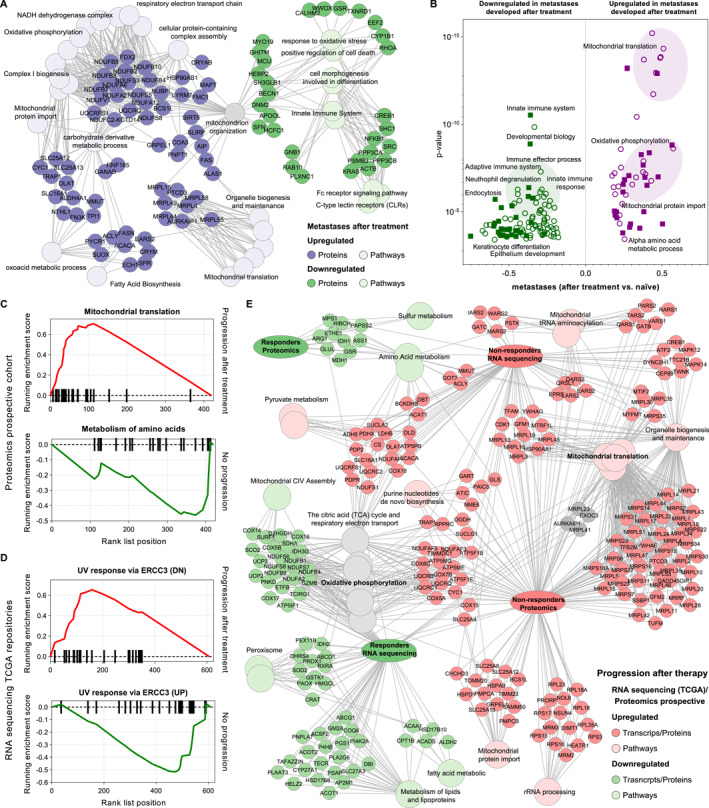
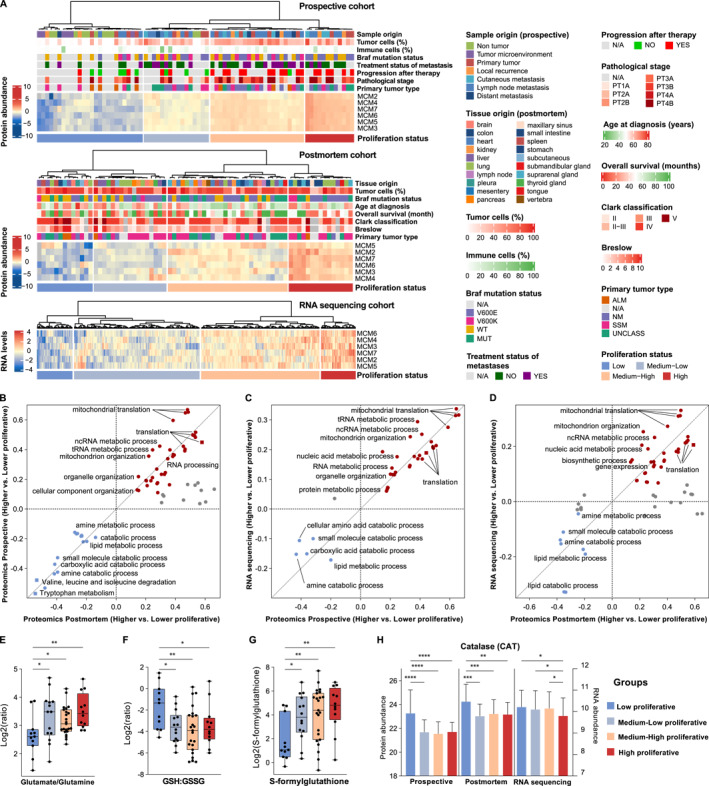
Methods: Quantitative proteomics was performed on 151 melanoma-related samples from a prospective cohort and postmortem tissues. Differential expression analysis identified mitochondrial proteins linked to disease aggression and treatment resistance. Functional enrichment analyses and in vitro validation using mitochondrial inhibitors were conducted to evaluate therapeutic potential.

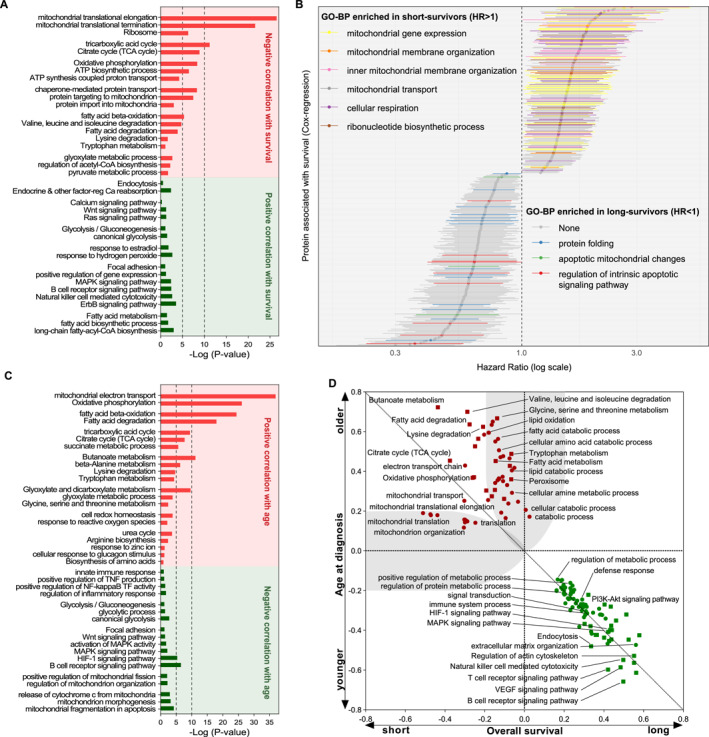
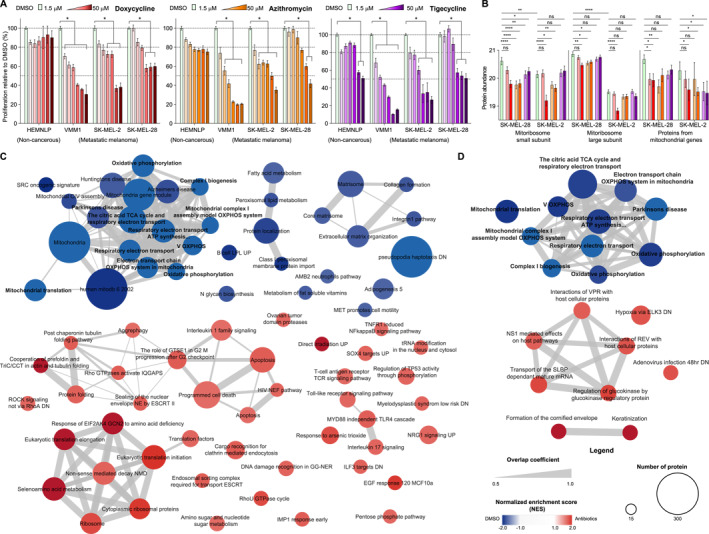
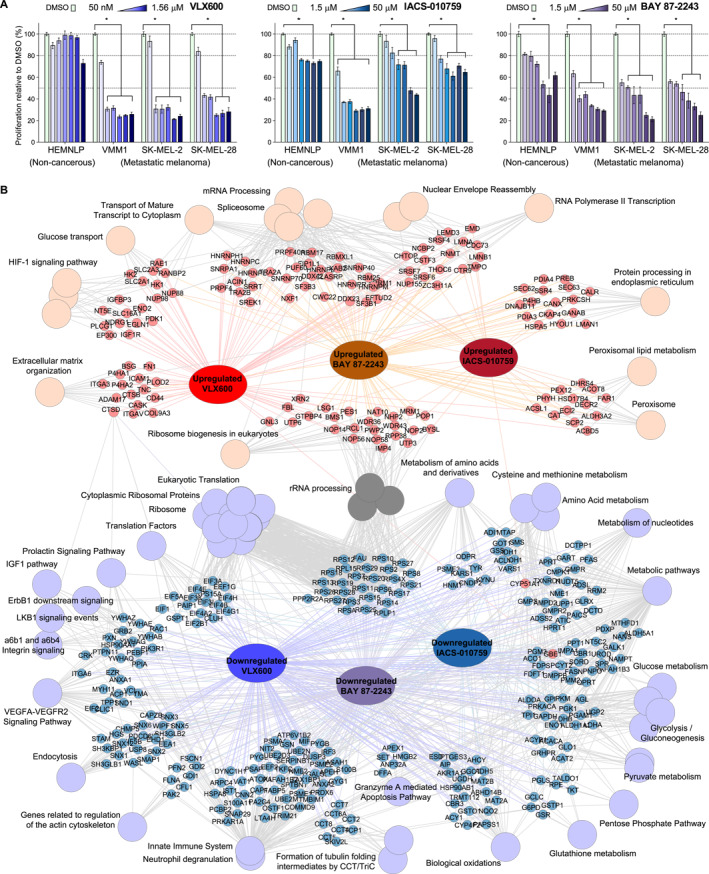
Results: Mitochondrial translation and oxidative phosphorylation (OXPHOS) were significantly upregulated in aggressive melanomas, particularly in BRAF-mutant and metastatic tumors. Inhibition of mitochondrial pathways using antibiotics (doxycycline, tigecycline, and azithromycin) and OXPHOS inhibitors (VLX600, IACS-010759, and BAY 87-2243) demonstrated dose-dependent antiproliferative effects in melanoma cell lines, sparing noncancerous melanocytes. These treatments disrupted mitochondrial function, suppressed key metabolic pathways, and induced apoptosis, highlighting the clinical relevance of targeting these pathways.

Conclusions: This study reveals mitochondrial pathways as critical drivers of melanoma progression and resistance, providing a rationale for targeting mitochondrial translation and OXPHOS in advanced melanoma. Combining mitochondrial inhibitors with existing therapies could overcome treatment resistance and improve patient outcomes.

Keywords: BRAF mutation; MCM complex; melanoma; mitochondrial metabolism; mitochondrial proteome; mitoribosomes; oxidative phosphorylation; proteomics.


Conflict of interest statement

Fábio C. S. Nogueira reports grant and/or contract funding from Fundação Carlos Chagas Filho de Amparo à Pesquisa do Estado do Rio de Janeiro. Jéssica Guedes reports fees for professional activities from Lund University. The other authors declare no conflicts of interest.

Figures

FIGURE 1
FIGURE 1
Overview of the study design. (A) Composition of the prospective cohort: samples were collected from 47 melanoma patients (P###) and categorized based on their anatomical origin into nontumor, tumor microenvironment, primary tumor, local recurrences, cutaneous metastases, lymph node metastases, and distant metastases. Connecting lines link patients with their included samples. (B) Postmortem cohort composition: scatter plot illustrates the relationship between the patients and the organs affected by metastasis. Accompanying bar plots summarize the number of metastases both by organs and by individual patients. (C) Proteomic workflow representation detailing the sample preparation and proteomic strategy followed protein identification and mitochondrial proteome filtering. (D) Total number of proteins identified in the study and those specifically categorized as mitochondrial according to the MitoMiner database. (E) Number of identified mitochondrial proteins and their mean abundance across samples from the Prospective cohort (upper panel) and the Postmortem cohort (lower panel). (F) Protein abundance levels of the mitochondrial transcription factor A (TFAM) and mitochondrial import receptor subunit TOM20 homolog (TOMM20) across anatomical groups in the prospective cohort and their corresponding ratios (G).
FIGURE 2
FIGURE 2
Mitochondrial proteome dynamics in melanoma is driven by patient, and to a lesser extent by origin of the sample, and clinical and molecular features. (A) Hierarchical clustering and heatmap visualization of samples from the prospective (left) and postmortem (right) cohorts based on the mitochondrial proteome. (B) Distribution of OXPHOS proteins, the TCA cycle, and mitochondrial translational machinery proteins, considering their relative level compared to the nontumor group. Negative and positive bars indicate the number of downregulated and upregulated proteins in the microenvironment or tumor groups. Colors other than gray refer to significantly dysregulated proteins. (C) Protein abundance profiles of upstream regulators of mitochondrial metabolism serine/threonine‐protein kinase mTOR (MTOR) and MITF. (D) Protein abundance profiles in the different groups of the mitochondrial glutaminase kidney isoform (GLS) and its isoform 3 (GAC), the mitochondrial CPS1 (ammonia), the glutamate dehydrogenase GLUD1 and GLUD2, and the PC. (E) Abundance ratio of glutamic acid and glutamine in the tissue samples. Significant differences between the nontumor group and all others were estimated through one‐way ANOVA and the cutoff was set based on a FDR approach, (*,**,***,****) q value <.05, .01, .001, and .0001, respectively). (F) Schematic representation of the mitochondrial pathways dysregulated in melanoma. (G) Significantly enriched pathways in proteins downregulated in at least one tumor group (primary, local recurrence, cutaneous, lymph node, and distant metastases) relative to nontumor. Shades of green indicate in how many groups of tumor samples the represented proteins are downregulated. (H) Significantly enriched pathway modules in the cluster of proteins showing higher levels in melanoma liver metastases. CPS1 indicates carbamoyl‐phosphate synthase; FDR, false discovery rate; MITF, microphthalmia‐associated transcription factor; OXPHOS, oxidative phosphorylation; PC, pyruvate carboxylase; TCA, tricarboxylic acid.
FIGURE 3
FIGURE 3
The tumor mitochondrial proteome profiling is associated with survival and age of the patients. (A) Functional enrichment analysis of mitochondrial proteins showing significant correlation with the overall survival of the patients. (B) Forest plot of the proteins significantly associated with the survival of the patients (Cox regression analysis). Significantly enriched Gene Ontology‐biological processes are highlighted. The analysis was conducted using the “survival” package in R programming. (C) Bar plot of the significantly enriched annotations in mitochondrial proteins associated with age of the patients at diagnosis. The analysis was performed using the online version of DAVID Bioinformatics. (D) 2D functional annotation enrichment analysis using the slopes (β) of the correlation between protein abundances and the overall survival of the patients (X‐axis) and the age at diagnosis (Y‐axis). The analysis was performed using the Perseus platform. Red and green dots correspond to biological annotations found significantly enriched in tumors from older and/or shorter survival patients, or younger and/or longer survival patients, respectively.
FIGURE 4
FIGURE 4
Mitochondrial translation machinery and OXPHOS upregulation have a strong impact on the progression of melanoma. (A) ToppCluster enrichment analysis and protein‐pathway interaction network of mitochondrial proteins significantly dysregulated in metastases developed during or after the patients received treatment. (B) Biological pathways (filled squares) and processes (circles) significantly enriched when comparing the mean protein abundances between the group of metastases that developed during or after treatment (purple) and those naive (green). Data are represented as a volcano plot where the annotation enrichment p value and the differences between groups were plotted. An FDR of 0.02 was set as the cutoff for significance. (C and D) GSEA plots of pathways significantly enriched in tumors from patients where the disease progressed after they received treatment, (C) proteomics prospective cohort and (D) RNA sequencing data set from the TCGA. (E) ToppCluster enrichment analysis and protein‐pathway interaction network of protein and transcripts significantly dysregulated between progression‐based groups. FDR indicates false discovery rate; GSEA, gene set enrichment analysis; OXPHOS, oxidative phosphorylation; TCGA, The Cancer Genome Atlas.
FIGURE 5
FIGURE 5
Tumor proliferation positively correlates with the mitochondrial translation machinery in melanoma. (A) Unsupervised hierarchical clustering of tumor samples based on the relative expression abundance of the six elements of the MCM complex from the prospective and postmortem proteomic cohorts and from the RNA sequencing data set on 443 melanoma tumor samples publicly available at the TCGA repositories. In each cohort, four groups were created based on the levels of the MCM2–MCM7, where the lowest levels correspond to low proliferative tumors. The differential abundances of proteins and transcripts between higher and lower proliferative groups in each cohort were submitted to 2D functional annotation enrichment analysis using KEGG pathways and GO biological processes reported for the mitochondrial proteins: postmortem versus prospective cohorts (B), prospective versus RNA sequencing cohorts (C), and postmortem versus RNA sequencing cohorts (D). Glutamate/glutamine (E), reduced and oxidized glutathione ratios (F), and relative levels of S‐formylglutathione (G) in the proliferation‐based groups from the prospective cohort. (H) Abundances of the catalase protein and transcript in the proliferation‐based groups from the three patient cohorts. Significant differences are represented by *,**,***,****; q value <.05, .01, .001, and .0001, respectively. GO indicates Gene Ontology; KEGG, Kyoto Encyclopedia of Genes and Genomes; MCM, minichromosome maintenance; TCGA, The Cancer Genome Atlas.
FIGURE 6
FIGURE 6
Anti‐protein synthesis antibiotics target the mitochondrial translation and inhibit the proliferation of melanoma cell lines. (A) Relative proliferation analysis in four different cell lines, HEMNLP (immortalized melanocytes, noncancerous), VMM‐1 (brain metastasis), SK‐MEL‐2 (cutaneous metastasis), and SK‐MEL‐28 (lymph node metastasis), treated with DMSO or antibiotics targeting the mitoribosomes. Doxycycline, azithromycin, and tigecycline were used at nine different doses in the low micromolar range (1.5, 3, 6, 12.5, 25, and 50 μM) and the proliferation was measured at 72 hours relative to DMSO treatment. Bars and errors correspond to the mean of three experimental replicates and the standard deviation respectively. *Indicates significantly inhibited proliferation compared to DMSO treatment (p value <.05, Kruskal–Wallis test, and Dunn’s correction for multiple comparisons). (B) Relative protein levels of the mitoribosome subunits and the protein products of the mitochondrial genes in SK‐MEL‐28 and SK‐MEL‐2 cell lines after 24 hours of treatment with two doses of the antibiotics. Data was extracted from the global proteomics analysis of the conditions tested. The statistical significance of the paired t‐test between control‐treated groups is represented (ns, *, **, ***, and **** significantly different with p values <.05, <.01, <.001, and <.0001, respectively). (C and D) Pathways significantly dysregulated in SK‐MEL‐28 (C) and SK‐MEL‐2 (D) cell lines treated with antibiotics. The functional enrichment analysis was performed using the GSEA using all curated databases. DMSO indicates dimethyl sulfoxide; GSEA, Gene Set Enrichment Analysis; ns, not significant.
FIGURE 7
FIGURE 7
Drugs targeting the mitochondrial oxidative phosphorylation inhibit proliferation in melanoma cell lines. (A) Relative proliferation analysis in four different cell lines, HEMNLP (immortalized melanocytes, noncancerous), VMM‐1 (brain metastasis), SK‐MEL‐2 (cutaneous metastasis), and SK‐MEL‐28 (lymph node metastasis), treated with DMSO or the OXPHOS inhibitors VLX600, IACS‐010759, and BAY 87‐2243. VLX600 was used at six different concentrations (50, 100, 200, 400, and 800 nM and 1.5 μM), IACS‐010759 and BAY 87‐2243 were evaluated in the low micromolar dose range (1.5, 3, 6, 12.5, 25, and 50 μM), the proliferation was measured at 72 hours relative to DMSO treatment. Bars and errors correspond to the mean of three experimental replicates and the standard deviation respectively. *Indicates significantly inhibited proliferation compared to DMSO treatment (p value <.05, Kruskal–Wallis test and Dunn’s correction for multiple comparisons). (B) Functional network interaction of the dysregulated proteome after treating the melanoma cell lines SK‐MEL‐28 and SK‐MEL‐2 with the OXPHOS inhibitors VLX600, IACS‐010759, and BAY 87‐2243. Each cell line was treated with two different doses of each drug and only proteins commonly dysregulated in both doses of the drug and in both cell lines were submitted to the functional enrichment analysis. The analysis was performed using the online version of ToppCluster function under the ToppGene suite. The provided curated pathways databases were used for the analysis and significant annotations were based on a p value <.05 with Bonferroni correction. DMSO indicates dimethyl sulfoxide; OXPHOS, oxidative phosphorylation.

Similar articles

References

    1. Dimitriou F, Krattinger R, Ramelyte E, et al. The world of melanoma: epidemiologic, genetic, and anatomic differences of melanoma across the globe. Curr Oncol Rep. 2018;20(11):87. doi: 10.1007/s11912-018-0732-8 - DOI - PubMed
    1. Kaiser I, Pfahlberg AB, Uter W, Heppt MV, Veierød MB, Gefeller O. Risk prediction models for melanoma: a systematic review on the heterogeneity in model development and validation. Int J Environ Res Public Health. 2020;17(21):7919. doi: 10.3390/ijerph17217919 - DOI - PMC - PubMed
    1. Saginala K, Barsouk A, Aluru JS, Rawla P, Barsouk A. Epidemiology of melanoma. Med Sci. 2021;9(4):139‐149. doi: 10.3390/medsci9040063 - DOI - PMC - PubMed
    1. Welch HG, Mazer BL, Adamson AS. The rapid rise in cutaneous melanoma diagnoses. N Engl J Med. 2021;384(1):72‐79. doi: 10.1056/nejmsb2019760 - DOI - PubMed
    1. Swetter SM, Thompson JA, Albertini MR, et al. NCCN guidelines insights: melanoma: cutaneous, version 2.2021. J Natl Compr Canc Netw. 2021;19(4):364‐376. doi: 10.6004/jnccn.2021.0018 - DOI - PubMed

MeSH terms