. 2025 Aug;14(22):e2502416.
doi: 10.1002/adhm.202502416. Epub 2025 Jun 23.

Antitumoral Efficacy of AuNRs-Laden ECFCs In Vitro and In Vivo: Decoding the Heat and Rays Combo Treatment in Breast Cancer and Melanoma Cells

Affiliations

Antitumoral Efficacy of AuNRs-Laden ECFCs In Vitro and In Vivo: Decoding the Heat and Rays Combo Treatment in Breast Cancer and Melanoma Cells

Cecilia Anceschi et al. Adv Healthc Mater. 2025 Aug.

Abstract

Radiotherapy remains a cornerstone in metastatic cancer treatment but is often hindered by tumor hypoxia and radioresistance. Gold nanorods (AuNRs) offer promise in enhancing radiotherapy through hyperthermia, yet their clinical impact is limited by poor tumor targeting. Building on the previous findings demonstrating the tumor-homing ability of Endothelial Colony Forming Cells (ECFCs) loaded with AuNRs, this study advances their use as a biologically targeted delivery system for precise radiotherapy enhancement. Using 3D in vitro tumor models and in vivo studies with nude rats, it is demonstrated that ECFCs actively home to hypoxic tumor regions, overcoming traditional nanoparticle delivery limitations. This targeted approach ensures efficient AuNR accumulation, enhancing photothermal activation and maximizing radiosensitization. In vitro, ECFC-loaded AuNRs significantly amplify radiotherapy effects, inducing ferroptosis in melanoma and inhibiting autophagy in breast cancer cells-revealing distinct tumor-specific mechanisms. Moreover, ECFC-AuNRs suppress tumor proliferation and angiogenesis, blocking vessel-like structure formation in vitro and in vivo. By integrating cellular therapy with nanotechnology, this study presents a novel strategy to counter radioresistance and improve therapeutic precision. These findings lay the foundation for a clinically viable, patient-specific approach, unlocking new possibilities in advanced cancer treatment.

Keywords: Endothelial Colony Forming Cells (ECFCs); autophagy; breast cancer; ferroptosis; gold nanorods; hyperthermia; melanoma; radiotherapy.


Conflict of interest statement

The authors declare no conflict of interest.

Figures
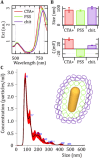
Figure 1
Figure 1
Chemical and physical characterization of gold Nanorods (AuNRs). A) Optical extinction spectra and B) Dynamic Light Scattering (DLS) analysis of gold nanorods through various steps of the synthetic protocol from the original CTA+ to the final chitosan coating. C) extract of a NanoSight histogram of the final particles dispersed in buffer confirming the corresponding DLS data and suggesting the presence of small aggregates. The inset provides a schematic representation of a particle coated with PSS (green) and chitosan (blue).
Figure 2
Figure 2
Evaluation of AuNR uptake, localization, and photothermal effects in ECFCs and tumor cells A) ICP analysis of cells treated at different time points with one dose or two consecutive equal doses of AuNPs. Significance was assessed by a one‐way ANOVA test followed by a Newman‐Keuls post‐test. Error bars indicate mean ± SD; asterisks (* p < 0.05, ** p < 0.001). All experiments were performed independently at least three times. B) Transmission electron micrograph of the indicated cells after overnight treatment with AuNRs. Scale bars represent 2 µm and 200 nm as indicated. C) Plot of the PA spectral trend of AuNP‐ECFC cells in comparison with tumor cells enriched with AuNRs. Enlarged image of the PA spectra of the tumor cells is shown on the right. D) Examples of thermographs recorded after exposing cultures of various cell types treated with chitosan‐coated gold nanorods to 808 nm laser light with a power density of 1 W cm‐2. The inset shows the thermographic images of the temperature detected on the surface of the irradiated well when the co‐culture reached 43 °C. E). Note that the recordings do not begin at the switch‐on event of the laser, which is evident as a change in the slope of the curves. The experimental setup used for photothermal testing, showing an irradiated well 1) in a custom multiwell plate connected to a chiller via silicon tubing 2), and showing a multimode optical fiber 3) and a thermal imaging camera 4). The inset is a photograph of a custom multiwell plate produced by additive manufacturing with a clear resin.
Figure 3
Figure 3
Integrated Confocal, Photoacoustic, and Histological Analysis of Tumor Spheroids with GFP‐Transfected Melanoma Cells and ECFCs and tumor mass. A) Confocal microscopy images of tumor spheroids composed of M6 GFP melanoma cells (green) and ECFCs, which are either naïve or enriched with AuNRs. ECFCs are stained with PKH26 (red). Scale bars represent 50 µm as indicated. The inset on the left shows optical images of an M6 cell monolayer before and after GFP transfection, confirming the successful incorporation of the green fluorescent protein. B) In the first raw, the photoacoustic acquisitions of a central slice of M6‐ECFC (dx) and M6‐AuNRs ECFC (sx), in the second raw the 3D PAUS volume reconstruction of the all tumor spheroids structure. The grayscale represent the US signal, the color scales (yellow, green, and red) represent the PA signal provided at different laser stimulation wavelength (970924680). On the bottom left specific photoacoustic signal intensity related to tumor spheroids with ECFCs enriched with AuNRs and those with naïve ECFCs, on the bottom right spectral photoacoustic comparison between a spheroid loaded with gold nanoparticles (AuNPs) and a bare control spheroid, where the photoacoustic signals were normalized prior to computing the relative difference according to the formula reported in the plot the normalized photoacoustic signals. This highlights wavelength regions where AuNPs significantly modulate the photoacoustic response C) panel a: PA signal intensity comparison of the mean values of the AuNR‐ECFC treated and non‐treated tumor masses during time, panel b: Normalized PA signal intensity from day 0 to day 3 of the treated and non‐treated tumor masses, panel c: 3D PAUS unmixed volume reconstruction of a referring treated tumor (gray scale for US, green color for the AuNR‐ECFCs, blue color for deoxygenated hemoglobin, red color for oxygenated hemoglobin), and panel d: the related 3D cross view plane visualization, panel e: 3D PAUS unmixed volume reconstruction of a referring treated tumor with naïve ECFCs (gray scale for US, blue color for deoxygenated hemoglobin, red color for oxygenated hemoglobin), and panel f: the related 3D cross view plane visualization. D) Representative images of histological assessments of rat tumor tissues one week after intravenous injection of naïve ECFCs or AuNR‐ECFCs, stained with silver to visualize gold nanorods (AuNRs), which appear as black precipitates. Black arrows indicate the presence of silver‐enhanced gold particles, primarily localized within the tumor microenvironment. E) Representative images of histological sections of the tumor masses stained with human CD31 (brown) and HIF‐1 alpha (red). The sections were counterstained with hematoxylin to visualize the nuclei. At the bottom enlarged views of the upper histological images, providing detailed visualization of the staining patterns. Scale bars represent 20 µm as indicated.
Figure 4
Figure 4
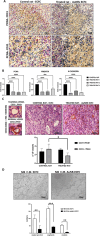
Multimodal Imaging and Gene Expression Analysis of Tumor Spheroids A) Optical images of tumor spheroids captured at the indicated time points, demonstrating the growth and morphological changes over time. Scale bars represent 100 µm as indicated. B) histogram illustrating the volume measurements of the tumor spheroids at day 7, providing quantitative data on spheroid growth. Confocal images of M6 GFP tumor spheroids C) and of MCF7 E) enriched with unstained naïve ECFC and AuNR‐ECFC with PCNA (Proliferating Cell Nuclear Antigen) stained in red, highlighting the proliferative cells within the spheroids. Scale bars represent 50 µm as indicated. D,F) Histograms showing the expression levels of vimentin and N‐cadherin genes in M6 and MCF‐7 cells, respectively, as measured by real‐time PCR. Significance was assessed by a one‐way ANOVA test followed by a Newman‐Keuls post‐test. Error bars indicate mean ± SD; asterisks (* p < 0.05; ** p < 0.001). All experiments were performed independently at least three times.
Figure 5
Figure 5
Histological and Gene Expression Analysis of Tumor Mass. (A) Representative images of histological sections of the tumor mass stained with human CD31 (brown) to indicate endothelial cells and PCNA (red) to highlight proliferating cells. Sections were counterstained with hematoxylin to visualize cell nuclei (blue). Scale bars represent 20 µm as indicated. (B) Histogram displaying the expression levels of Vimentin, N‐cadherin, and PCNA genes as measured by real‐time PCR. This provides insights into the mesenchymal and proliferative markers in tumor mass. Significance was assessed by a one‐way ANOVA test followed by a Newman‐Keuls post‐test. Error bars indicate mean ± SD; asterisks (*p < 0.05). (C) Representative images of histological sections of the tumor mass stained with human CD31 (brown) and PAS (Periodic Acid‐Schiff, pink) to indicate glycogen and other carbohydrate‐rich structures. The accompanying histogram quantitatively represents the number of vessels positive for CD31 alone and those positive for both CD31 and PAS, highlighting the vascular characteristics of the tumor. Scale bars represent 20 µm as indicated.
Figure 6
Figure 6
Multimodal analysis of melanoma cells M6 co‐cultures with naïve or AuNR‐treated ECFCs under hyperthermia, radiotherapy, or combined treatment. A) Representative optical microscope images of M6 melanoma cells co‐cultured with naïve ECFCs or AuNR‐treated ECFCs at a ratio of 5:1.‐. Scale bars represent 100 µm as indicated. B) Example of thermographs recorded after exposing M6/ECFC‐AuNR co‐cultures to 808 nm laser light with a power density of 1 W/cm2. On the right the thermographic image of the temperature detected on the surface of the irradiated well when the co‐culture reached 43 °C. C) Optical images of the colonies formed after 10 days by the M6/ECFC co‐cultures subjected to the indicated treatments. Colonies were stained with May‐Grünwald and then counted. Statistical analysis was performed using one‐way Anova. Representative data from three independent experiments are shown (mean ± SD). Asterisks indicate significant differences (* p < 0.0001) compared to untreated cells. D) Representative images of comet morphology of M6‐ECFCs after irradiation with a 2 Gy dose, hyperthermia, and combination treatment. The graphs on the right indicate the levels of DNA damage, expressed as the percentage of DNA in the tail. Significance was assessed by a one‐way ANOVA test followed by a Newman–Keuls post‐test. Error bars indicate mean ± SD; asterisks (* p < 0.05) indicate significant differences E) Western blot analysis of γH2AX levels in M6‐ECFC co‐cultures. Vinculin was used as a loading control. F) Confocal images of co‐cultured cells subjected to the indicated treatments and stained with the DCFDA probe. Green fluorescence indicates superoxide production. G) Confocal microscopy images of co‐cultured cells labeled with BODIPY 581/591 for the detection of lipid peroxides. Scale bars represent 50 µm as indicated. Histograms reports the quantification of the BODIPY C11 (581/590) oxidation ratio of biological replicates. Error bars indicate mean ± SD; asterisks (* p < 0.05) indicate significant differences. H) Determination of lipid peroxidation by 4‐HNE‐fluorescence analysis. IF analysis using anti‐4HNE‐ab (red) and DAPI (blue) showing increased HNE adducts in the co‐cultures that had undergone the combination treatment. Scale bars represent 20 µm as indicated.
Figure 7
Figure 7
Multimodal analysis of breast cancer cells co‐coltures with naïve or AuNR‐treated ECFCs under hyperthermia, radiotherapy, or combined treatment. A) Representative optical microscope images of MCF7 cells co‐cultured with naïve ECFCs or AuNR‐treated ECFCs at a ratio of 5:1. Scale bars represent 100 µm as indicated B) Example of thermographs recorded after exposing MCF7/AuNR‐ECFC co‐cultures to 808 nm laser light with a power density of 1 W/cm2. On the right the thermographic images of the temperature detected on the surface of the irradiated well when the co‐culture reached 43 °C. C) Optical images of the colonies formed after 10 days by the MCF7/ECFC co‐cultures subjected to the indicated treatments. Colonies were stained with May‐Grünwald and then counted. Statistical analysis was performed using one‐way anova. Representative data from three independent experiments are shown (mean ± SD). Asterisks indicate significant differences (* p < 0.0001) compared to untreated cells. D) Representative images of comet morphology of MCF7‐ECFCs after irradiation with a 2 Gy dose, hyperthermia, and combination treatment. The graphs on the right indicate the levels of DNA damage, expressed as the percentage of DNA in the tail. Significance was assessed by a one‐way ANOVA test followed by a Newman–Keuls post‐test. Error bars indicate mean ± SD; asterisks (* p < 0.05) indicate significant differences E) Western blot analysis of γH2AX levels in M6‐ECFC co‐cultures. Vinculin was used as a loading control. G) Representative images of co‐cultures stained with CYTO‐ID Autophagy detection kit. Green fluorescence indicates selective positivity for the staining, which labels autophagosomes. Scale bars represent 20 µm as indicated. Histogram shows the quantification of the mean green fluorescence ± standard deviation of three independent experiments. H) After the treatments, co‐cultures were stained with BioTracker NIR633 Lysosome Dye (LysoTracker), a fluorescent stain for imaging lysosome localization and morphology in live cells. Scale bars represent 50 µm as indicated. Graphs represent the quantification of the number of red fluorescent lysosomes per cell. Significance was assessed by a one‐way ANOVA test followed by a Newman–Keuls post‐test. Error bars indicate mean ± SD; asterisks (* p < 0.05, ** p < 0.001) indicate significant differences.
Figure 8
Figure 8
Schematic representation of the mechanistic interplay of hyperthermia and radiotherapy in two different cancer types, created in Biorender.

References

    1. Allen C., Her S., Jaffray D. A., Adv Drug Deliv Rev 2017, 109, 1. - PubMed
    1. Breur K., Arch Chir Neerl 1973, 25, 341. - PubMed
    1. Chandra R. A., Keane F. K., Voncken F. E. M., Thomas C. R., Lancet 2021, 398, 171. - PubMed
    1. Sia J., Szmyd R., Hau E., Gee H. E., Front Cell Dev Biol 2020, 8, 41. - PMC - PubMed
    1. Baskar R., Dai J., Wenlong N., Yeo R., Yeoh K. W., Front. Mol. Biosci. 2014, 1, 24. - PMC - PubMed