. 2025 Jun;14(6):e70089.
doi: 10.1002/jev2.70089.

Extracellular Vesicle Proteome Analysis Improves Diagnosis of Recurrence in Triple-Negative Breast Cancer

Affiliations

Extracellular Vesicle Proteome Analysis Improves Diagnosis of Recurrence in Triple-Negative Breast Cancer

Ju-Yong Hyon et al. J Extracell Vesicles. 2025 Jun.

Abstract

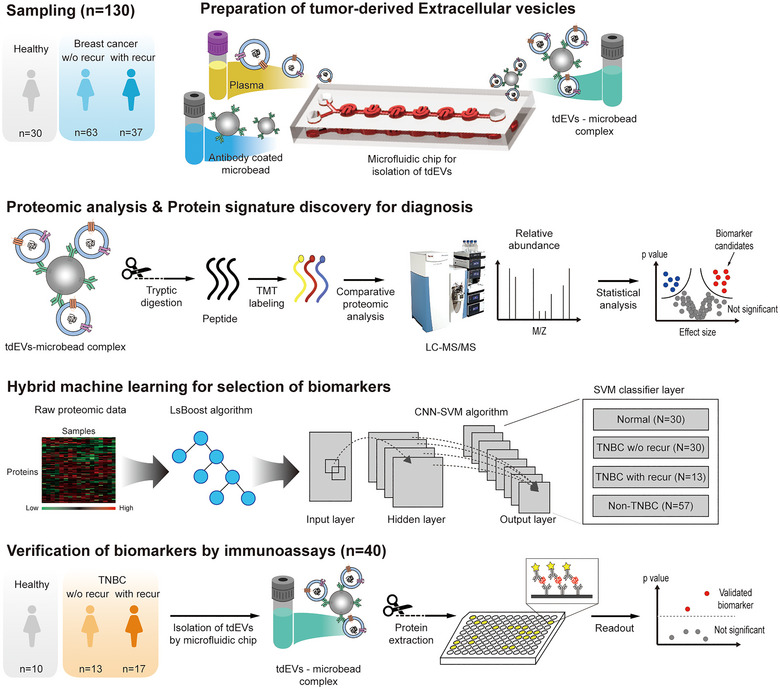
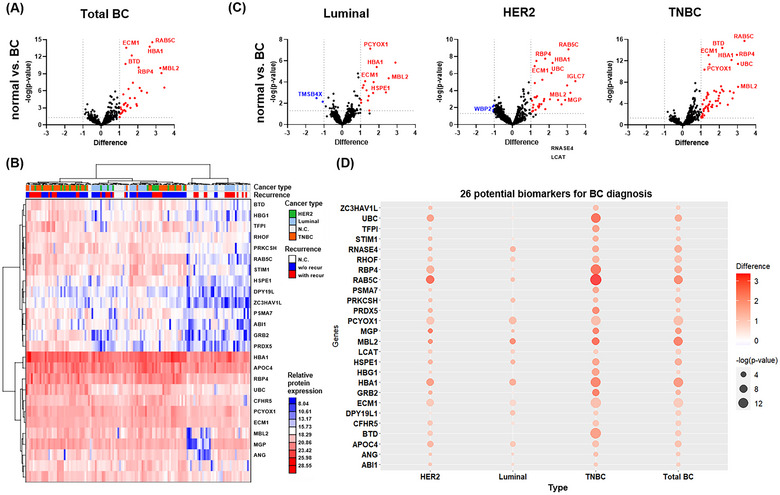
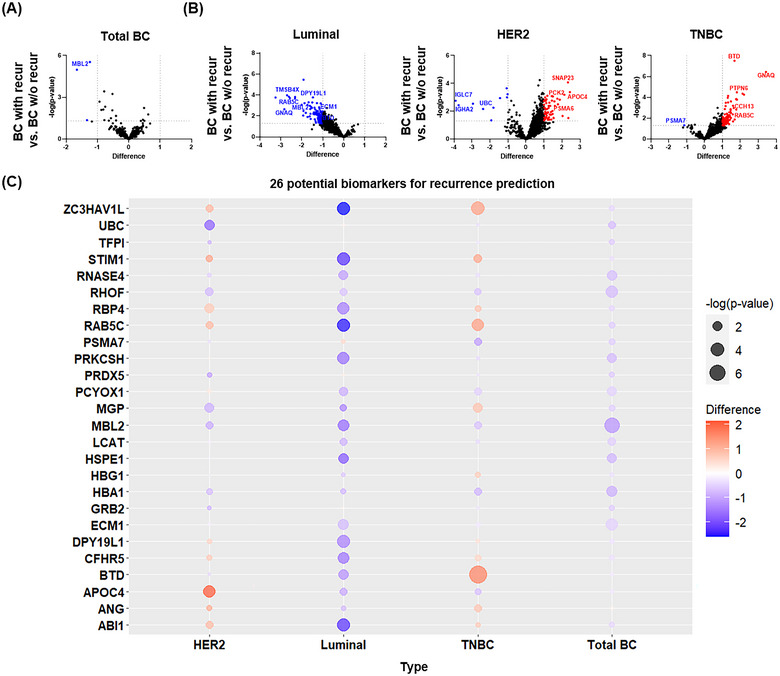
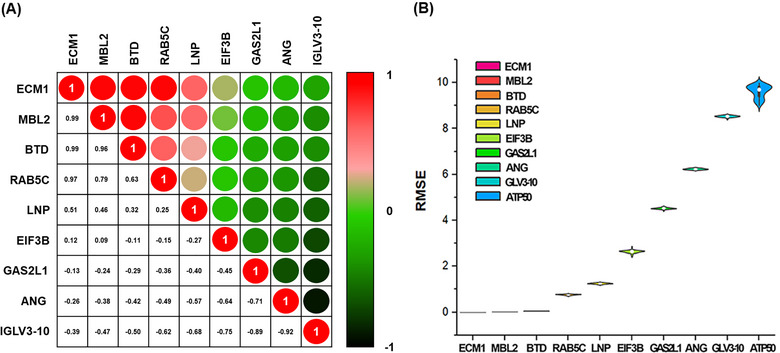
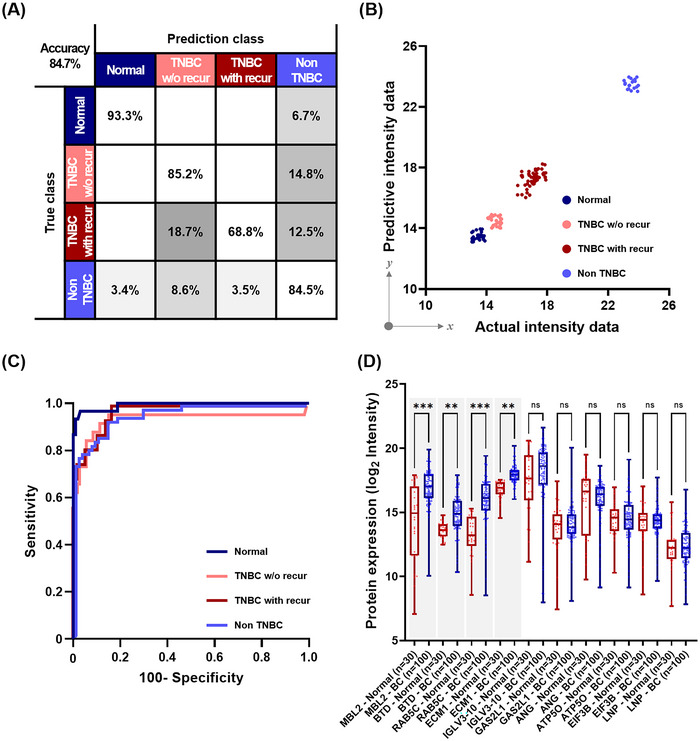
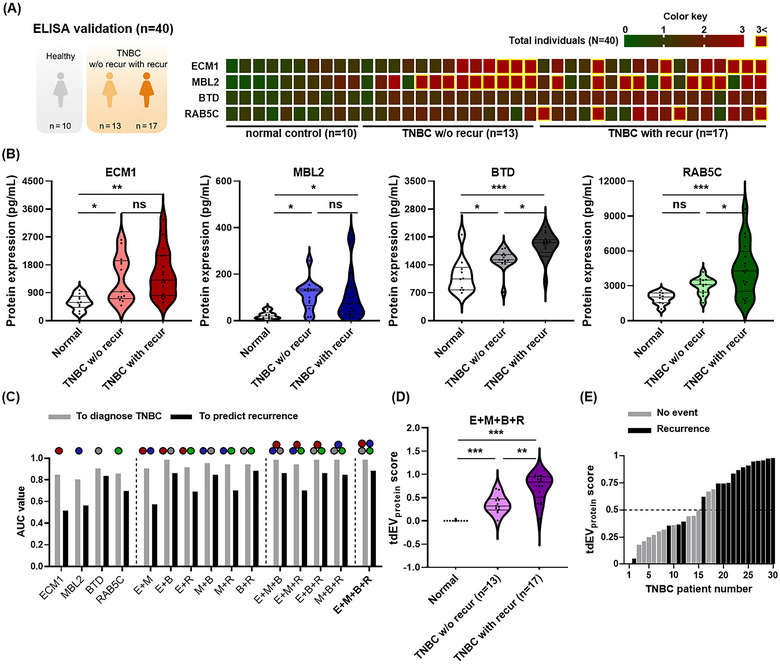
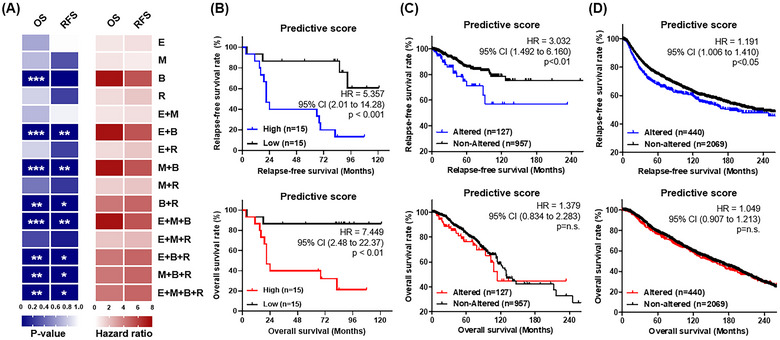
We explored the diagnostic utility of tumor-derived extracellular vesicles (tdEVs) in breast cancer (BC) by performing comprehensive proteomic profiling on plasma samples from 130 BC patients and 40 healthy controls (HC). Leveraging a microfluidic chip-based isolation technique optimized for low plasma volume and effective contaminant depletion, we achieved efficient enrichment of tdEVs. Proteomic analysis identified 26 candidate biomarkers differentially expressed between BC patients and HCs. To enhance biomarker selection robustness, we implemented a hybrid machine learning framework integrating LsBoost, convolutional neural networks, and support vector machines. Among the identified candidates, four EV proteins. ECM1, MBL2, BTD, and RAB5C. not only exhibited strong discriminatory performance, particularly for triple-negative breast cancer (TNBC), but also demonstrated potential relevance to disease recurrence, providing prognostic insights beyond initial diagnosis. Receiver operating characteristic (ROC) curve analysis demonstrated high diagnostic accuracy with an area under the curve (AUC) of 0.924 for BC and 0.973 for TNBC, as determined by mass spectrometry. These findings were further substantiated by immuno assay validation, which yielded an AUC of 0.986 for TNBC. Collectively, our results highlight the potential of EV proteomics as a minimally invasive, blood-based platform for both accurate detection and recurrence risk stratification in breast cancer and its aggressive subtypes, offering promising implications for future clinical applications.

Keywords: diagnosis; machine learning; microfluidics; proteomic analysis; triple‐negative breast cancer; tumour derived extracellular vesicles.


Conflict of interest statement

The authors declare no conflicts of interest.

Figures

FIGURE 1
FIGURE 1
Schematic overview of the workflow for biomarker discovery by using proteomics with tdEVs to predict subtypes and the probability of BC recurrence. Three groups of patients, including normal, BC w/o recur and BC with recur, were recruited and asked to provide plasma samples. The samples were injected into a microfluidic chip with a BC‐related antibody (EpCAM and CD49f) coated microbead solution. The microfluidic chip produced tdEVs‐microbead complexes within 1 min based on immunoaffinity. Proteomic analysis by LC‐MS/MS using a tandem mass tag system identified signature proteins of tdEV that could be used to predict BC recurrence. A hybrid ML algorithm (LsBoost‐CNN‐SVM) was introduced to select biomarkers. The intensities of each protein were regressed by the LsBoost algorithm, and the data from LsBoost were classified using the CNN‐SVM hybrid algorithm. The selected four tdEV biomarkers were validated with plasma samples from 10 normal volunteers and 30 TNBC patients. The tdEVs prepared by the microfluidic chip were analysed using a conventional ELISA. BC, breast cancer; CNN, convolutional neural network; ELISA, enzyme‐linked immunosorbent assay; SVM, support vector machine; tdEVs, tumour‐derived EVs; with recur, with recurrence; w/o recur, without recurrence.
FIGURE 2
FIGURE 2
Comparative analysis of 985 tdEV proteins by BC subtype. (A) The volcano plot analysis identified DEPs for breast cancer for 985 tdEV proteins from healthy people (n = 30) and total breast cancer patients (n = 100) (red dot: p < 0.05, log2(difference) > 1). (B) Heatmap of Euclidean distances and associated hierarchical clustering dendrograms between 26 significant proteins and patients. In this panel, individual entities are labelled with two colour codes. The first colour represents the breast cancer subtype (HER2 is green, luminal is light blue, N.C. is grey, and TNBC is orange). The second colour codes the recurrence of cancer patients (white for N.C., blue for without recurrence of cancer, and red for with recurrence of cancer. (C) The volcano plot analysis identified DEPs for breast cancer from among 985 tdEV proteins from healthy individuals and each subtype (luminal, HER2, and TNBC) of breast cancer patients (red dot: p < 0.05, log2(difference) > 1), blue dot: p < 0.05, log 2(difference)←1). (D) Bubble plot analysis showed multiple significant differences by subtype for the 26 possible biomarkers identified in the volcano plot showing differences between breast‐cancer patients and healthy people. BC, breast cancer; DEPs, differentially expressed proteins; N.C., normal control; tdEV, tumour‐derived extracellular vesicles; TNBC, triple‐negative breast cancer.
FIGURE 3
FIGURE 3
Comparative analysis of 985 tdEV proteins in patients with and without recurrence by BC subtype. (A) The volcano plot analysis identified DEPs from among 985 tdEV proteins from breast cancer patients with (n = 37) and without recurrence (n = 63) from the total cohort of breast cancer patients (n = 100) (blue dot: p < 0.05, log 2(difference)←1). (B) DEPs identified by volcano plot analysis of 985 tdEV proteins from breast cancer patients with and without recurrence for each subtype (red dot: p < 0.05, log 2(difference) > 1), blue dot: p < 0.05, log 2(difference)←1). (C) Bubble plot analysis showed multiple significant differences by recurrence and subtype for the 26 possible biomarkers identified in the volcano plot showing differences between breast cancer and healthy people.BC, breast cancer; DEPs, differentially expressed proteins; tdEV, extracellular vesicles.
FIGURE 4
FIGURE 4
Correlation matrix according to regression learning of biomarker intensity using the LSBoost algorithm. The top 10 biomarkers are presented in ascending order of normalized RMSE (Root Mean Squared Error) values using the algorithm's characteristic equation for the 985 biomarkers extracted through proteomics analysis. (A) The correlation matrix shows the relationship between each biomarker among the top 10 biomarkers. (B) The plot of the results of 50 iterations of the algorithm as the distribution of the RMSE across biomarkers.
FIGURE 5
FIGURE 5
Training results of the hybrid algorithm (LsBoost‐CNN‐SVM). (A) Confusion matrix of training results for four classes (Normal, TNBC w/o recur, TNBC with recur, and non‐TNBC). (B) Scatter plot of actual and predicted data in the training set. (C) ROC curve and AUC values of each class. (D) Protein expression levels of the top 10 predicted proteins as significant in differentiating patients with BC from normal. Statistical analyses were performed using an unpaired Student's t‐test between two groups.**p < 0.01; ***p < 0.001. AUC, area under the ROC curve; ns, not significant; ROC, receiver operating characteristic; TNBC, triple‐negative breast cancer; with recur, with recurrence; w/o recur, without recurrence.
FIGURE 6
FIGURE 6
Validation of the top 4 tdEV protein markers after ML analysis using ELISA (N = 40). (A) Heatmap illustrating the enrichment of tdEV protein markers from TNBC w/o recur (n = 13) and TNBC with recur (n = 17) compared with normal controls (n = 10). The colour key represents the fold change arbitrarily standardized to the average of the normal controls. (B) Comparison of the protein expression levels of tdEV protein markers in each group, including normal controls, TNBC w/o recur, and TNBC with recur. Statistical analyses were performed using one‐way ANOVA with Turkey's multiple comparisons between three groups (ns, not significant; *p < 0.05; **p < 0.01; ***p < 0.001). (C) ROC curve analyses for single and combined EV protein markers. The AUC values were calculated using the Wilcoxon/Mann–Whitney test. (D) Comparison of the tdEVprotein scores between the groups. (E) The tdEVprotein score measuring for 30 TNBC patients. Black bars indicate the patients who underwent recurrence and grey bars indicate those with no recurrence event. AUC, area under the ROC curve; ROC, receiver operating characteristic; tdEV, tumour‐derived extracellular vesicles; TNBC, triple‐negative breast cancer; with recur, with recurrence; w/o recur, without recurrence.
FIGURE 7
FIGURE 7
Evaluation of prognostic potential for tdEV protein markers. (A) Integrative analysis of the hazard ratio (red heatmap) and p value (blue heatmap) of OS and RFS tested with single and combined EV protein markers. Kaplan–Meier survival curve of RFS and OS stratified by four protein‐altered and non‐altered groups from our TNBC patient study (B), from the Pan‐Cancer Atlas (C), and METABRIC data (D). The log‐rank (Mantel–Cox) test statistic compares estimates of the HR between four protein marker high and low expression groups (*p < 0.05; **p < 0.01; ***p < 0.001). TNBC, triple negative breast cancer; EV, extracellular vesicle; HR, hazard ratio; CI, confidence interval; RFS, relapse‐free survival; OS, overall survival.

Similar articles

References

    1. Aykut, B. , Pushalkar S., Chen R., et al. 2019. “The Fungal Mycobiome Promotes Pancreatic Oncogenesis Via Activation of MBL.” Nature 574, no. 7777: 264–267. - PMC - PubMed
    1. Bandu, R. , Oh J. W., and Kim K. P.. 2024. “Extracellular Vesicle Proteins as Breast Cancer Biomarkers: Mass Spectrometry‐based Analysis.” Proteomics 24: 2300062. - PubMed
    1. Baptistella, A. R. , Landemberger M. C., Dias M. V., et al. 2019. “Rab5C Enhances Resistance to Ionizing Radiation in Rectal Cancer.” Journal of Molecular Medicine (Berlin) 97: 855–869. - PubMed
    1. Baranova, A. , Krasnoselskyi M., Starikov V., et al. 2022. “Triple‐Negative Breast Cancer: Current Treatment Strategies and Factors of Negative Prognosis.” Journal of Medicine and Life 15, no. 2: 153–161. - PMC - PubMed
    1. Bedard, P. L. , Hansen A. R., Ratain M. J., and Siu L. L.. 2013. “Tumour Heterogeneity in the Clinic.” Nature 501: 355–364. - PMC - PubMed

LinkOut - more resources