. 2025 Jun;14(6):e70105.
doi: 10.1002/jev2.70105.

Macrophages Internalize Epithelial-Derived Extracellular Vesicles That Contain Ferritin via the Macrophage Scavenger Receptor 1 to Promote Inflammatory Bowel Disease

Affiliations

Macrophages Internalize Epithelial-Derived Extracellular Vesicles That Contain Ferritin via the Macrophage Scavenger Receptor 1 to Promote Inflammatory Bowel Disease

Wenxin Zhang et al. J Extracell Vesicles. 2025 Jun.

Abstract

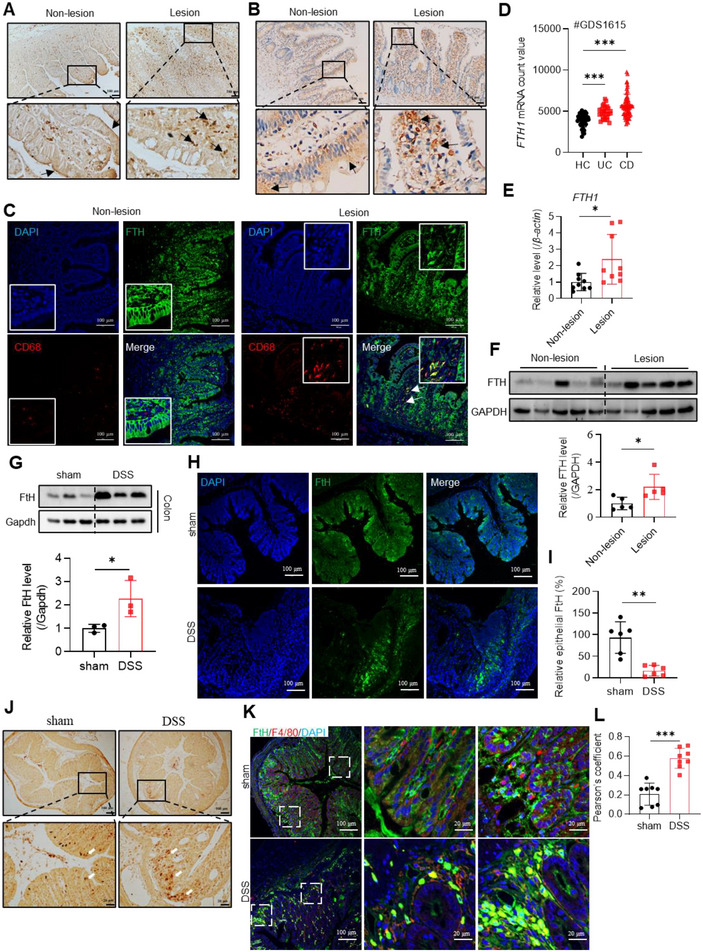
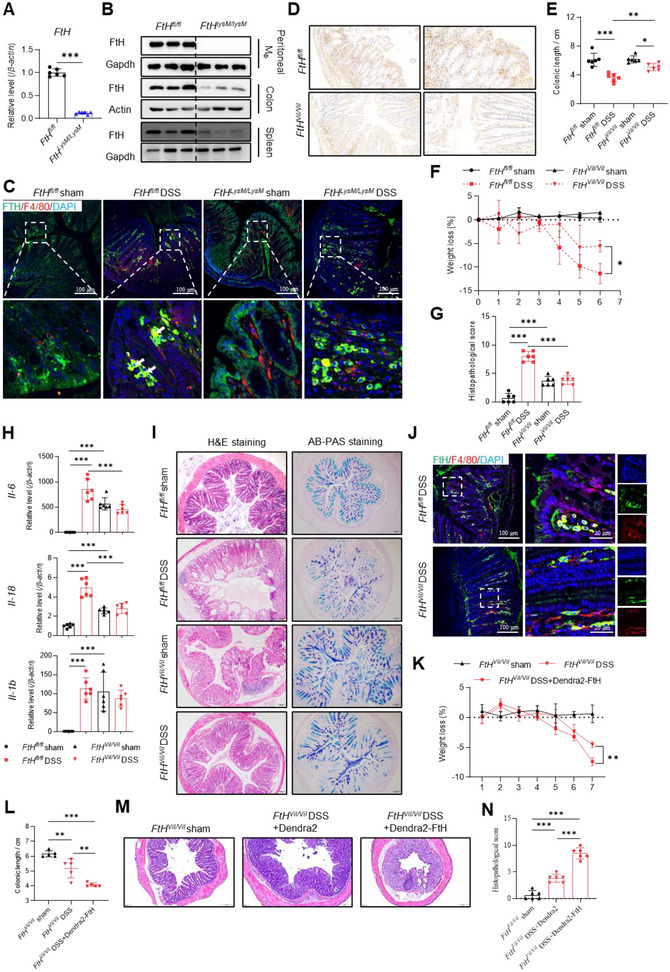
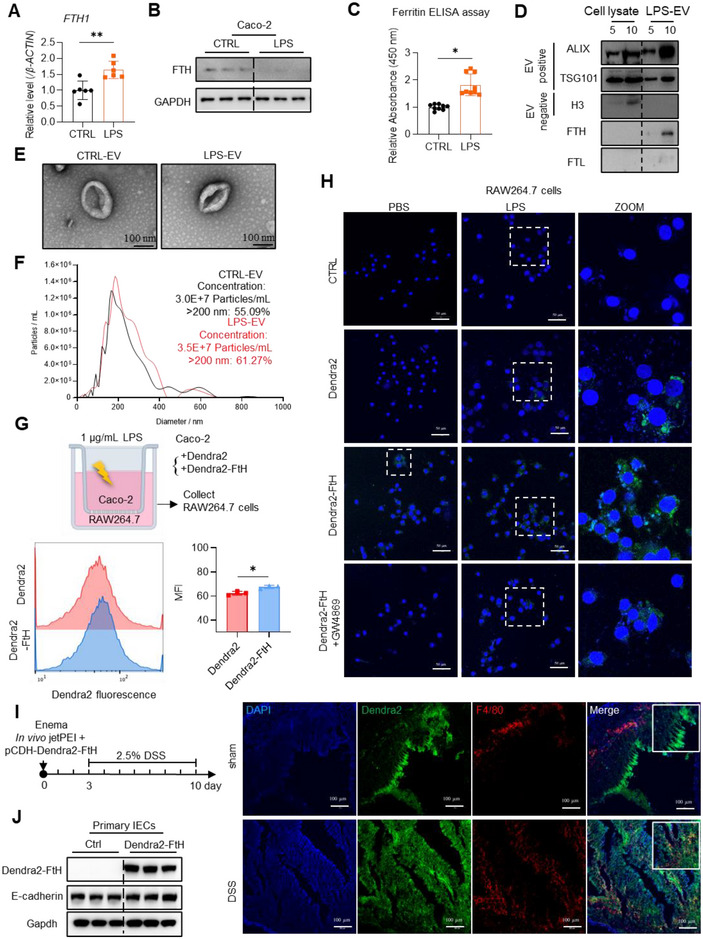
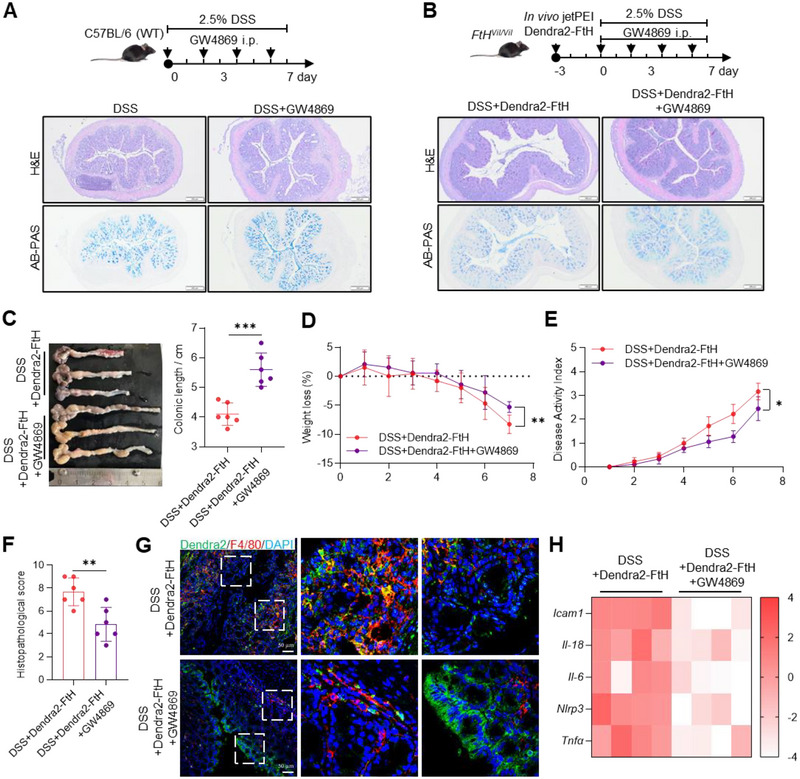
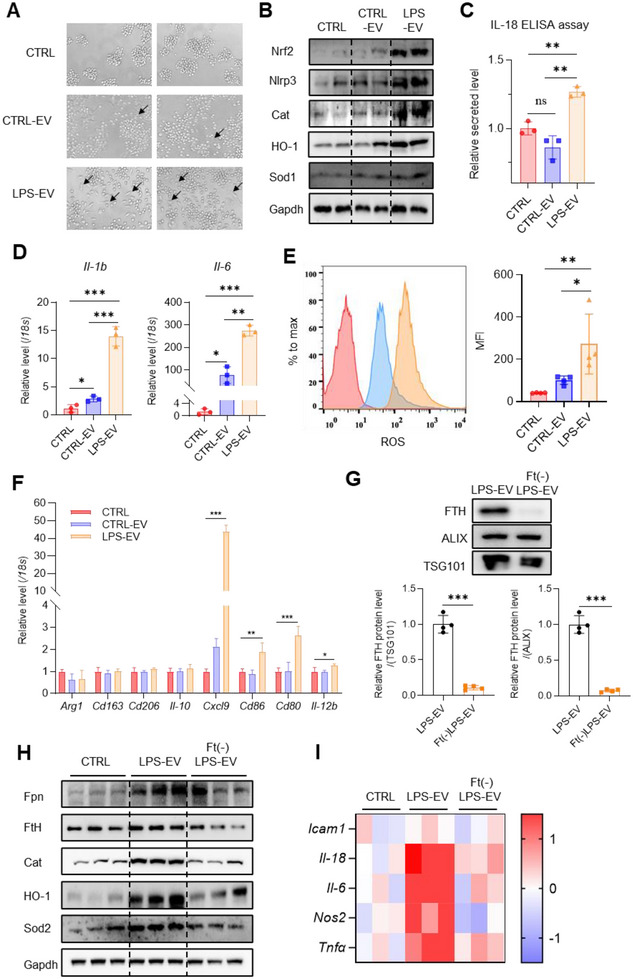
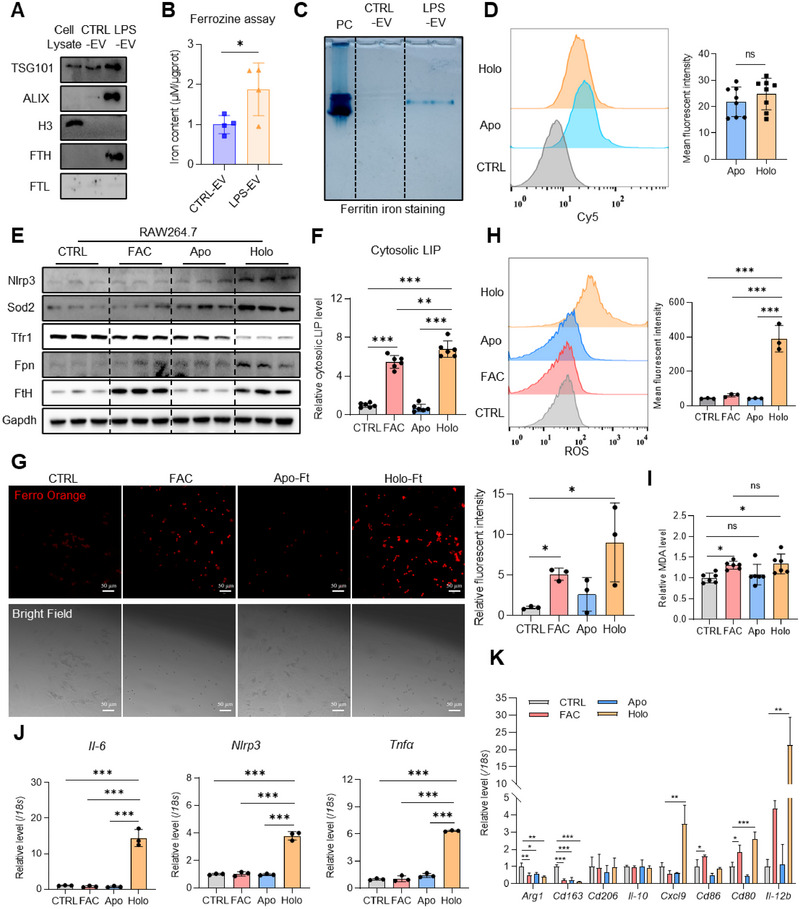
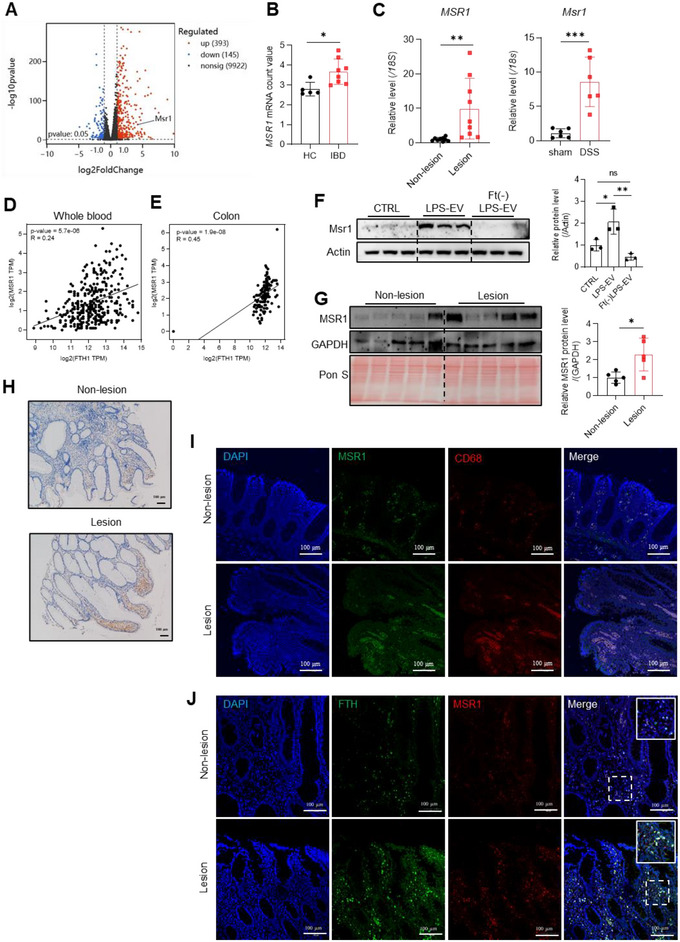
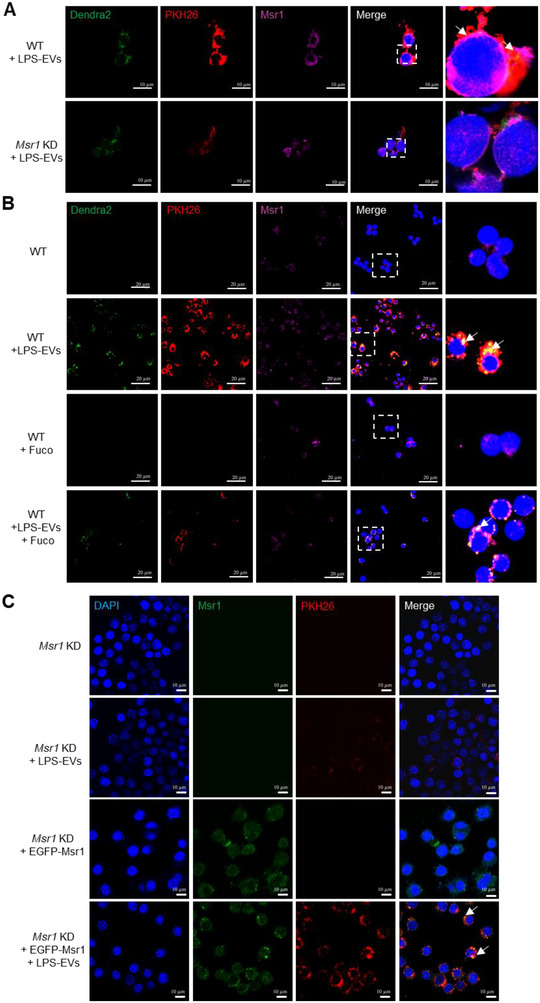
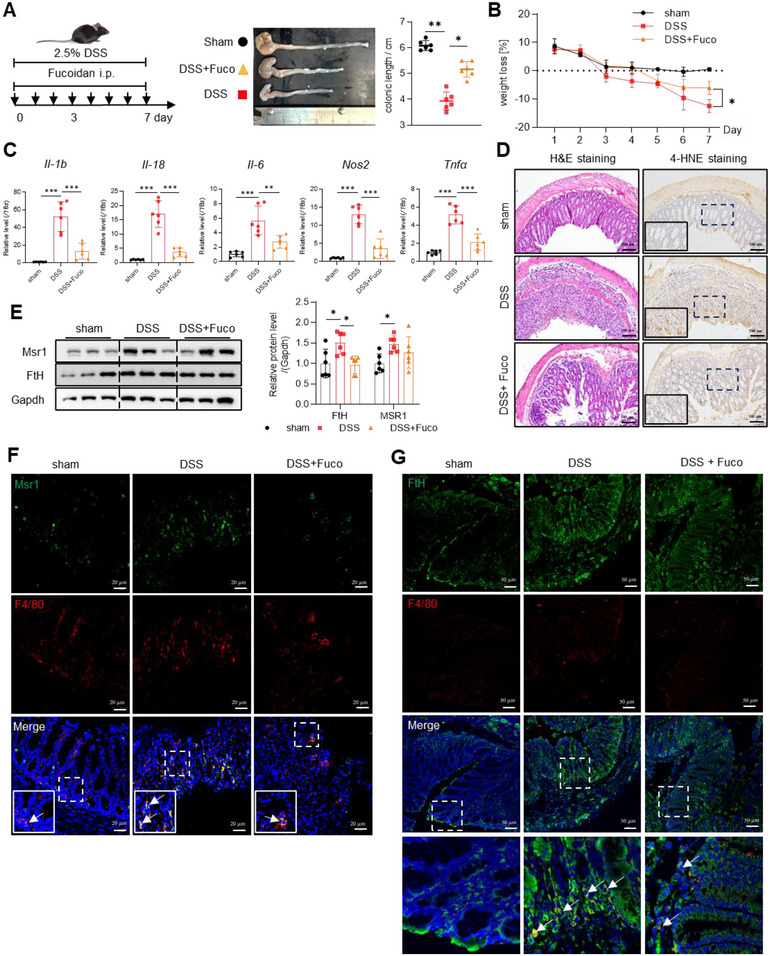
The incidence of inflammatory bowel disease (IBD) is on the rise, yet current clinical treatments are limited. Previous studies have identified impairments in both systemic and local iron metabolism in IBD patients. However, the impact of iron dyshomeostasis on the development and pathogenesis of IBD remains elusive. In this study, we confirmed iron deposition in inflamed intestinal lesions of IBD patients and mice with DSS-induced colitis, accompanied by distinct distribution patterns of the iron storage protein ferritin. To reveal the role of ferritin in the involvement of pathology of IBD, we constructed intestinal epithelial cell- or myeloid-specific ferritin H (FtH) knockout mice and demonstrated that intestinal epithelial cells (IECs) release extracellular vesicles (EVs) that contain iron-loaded ferritin. These EVs are internalized by macrophages via the macrophage scavenger receptor 1 (Msr1), leading to the activation of inflammatory responses and oxidative stress, thereby exacerbating colitis severity. Genetic deletion of FtH in IECs or blockage of macrophage ferritin uptake, either through Msr1 inhibitor fucoidan or through Msr1 knockdown (KD), suppressed inflammatory symptoms. Thus, EVs containing iron-loaded ferritin released from IECs activate macrophages and contribute to IBD development, supporting that IBD patients with iron deficiency anaemia are often prescribed iron supplementation in a remission phase, other than in an active phase of the disease. Pharmacological inhibition of this ferritin secretion and engulfing process provides a therapeutic target for the disease.

Keywords: IBD; extracellular vesicles; ferritin trafficking; intestinal epithelial cells; macrophage scavenger receptor 1; macrophages.


Conflict of interest statement

The authors declare no conflicts of interests.

Figures

FIGURE 1
FIGURE 1
The expression patterns of FTH are changed in IBD patients and DSS‐induced murine colitis model, in which FtH decreases in epithelial cells and increases in macrophages at protein levels. (A) Representative images of DAB‐enhanced Prussian blue iron‐stained intestinal sections from IBD patients. Arrows indicate iron deposit. N = 10/group. Bar: 100 µm. (B) Representative images of immunohistochemistry for FTH in intestinal sections from IBD patients. Arrows indicate FTH positive area. Bar: 100 µm. (C) Confocal images of the FTH (green) and macrophage marker CD68 (red) in intestinal sections from IBD patients. Arrows indicate co‐localization. Nuclei were labelled with DAPI (blue). Bar: 100 µm. (D) FTH1 mRNA levels in peripheral blood mononuclear cells from IBD patients (UC: ulcerative colitis; CD: Crohn's disease). The data were collected from GEO profile GDS1615. (E) FTH1 mRNA levels in intestinal sections from IBD patients collected in this study, revealed by RT‐qPCR. N = 9/group. (F) FTH protein levels in intestinal sections from IBD patients, revealed by western blotting. N = 5/group. (G–L) Results from 2.5% DSS‐induced murine colitis model. (G) FtH protein levels in colon tissue and quantification of the band intensity. (H) Confocal images of FtH in colon tissues. (I) Quantification of fluorescence intensity for epithelial FtH. (J) DAB‐enhanced Prussian blue iron‐stained colon tissues. (K) Confocal images of FtH and macrophage marker F4/80. (L) Pearson's coefficient for macrophage (F4/80 in red) and FtH (in green) overlay. Nuclei were labelled with DAPI (blue). Bar: 20 µm. Values are shown as mean ± SEM. t‐test was used for the comparison between the two groups. One‐way ANOVA was utilized for the comparison among more than 3 groups. *p < 0.05, **p < 0.01, ***p < 0.001.
FIGURE 2
FIGURE 2
FtH depletion in IECs, not in macrophages, alleviates the severity of DSS‐induced colitis in mice. (A) FtH mRNA levels in bone‐marrow‐derived macrophages (BMDM). (B) Protein levels of FtH in peritoneal macrophages and macrophage‐rich tissues (colon, spleen) revealed by western blotting. (C) Confocal images showing FtH (green) and F4/80 (red). Nuclei were labelled with DAPI (blue). Bar: 100 µm. (D) Representative images of anti‐FtH immunohistochemistry in intestinal sections from FtHfl/fl and FtHVil/Vil mice. Bar: 100 µm. (E) Quantification of colonic length. (F) Body weight loss. (G) Histopathological scores. (H) mRNA levels of inflammatory genes of colon tissue detected by RT‐qPCR. (I) Hematoxylin and eosin (H&E)‐stained and Alcian Blue‐Periodic Acid Schiff (AB‐PAS)‐stained colon tissues. Bar: 100 µm. (J) Representative images of immunofluorescence for FtH (green) and F4/80 (red). Quantification of percentage of FtH+F4/80+ cells. Nuclei were labelled with DAPI (blue). Bar: 100 µm. (K–N) Dendra2‐FtH‐expression via plasmid/PEI in IECs of FtHVil/Vil mice. Post‐72 h, the mice drank 2.5% DSS water for 7 days. Bar: 30 µm. (K) Weight loss. (L) Colon length. (M) Histology of colon section, revealed by H&E staining. Bar: 100 µm. (N) Histopathological scores. Values are shown as mean ± SEM. t‐test was used for the comparison between the two groups; one‐way ANOVA was utilized for the comparison among more than 3 groups and two‐way ANOVA was utilized for the body weight loss. N = 6. *p < 0.05, **p < 0.01, ***p < 0.001. PEI: polyethyleneimine.
FIGURE 3
FIGURE 3
DSS‐induced intestinal inflammation elicits ferritin trafficking from IECs to macrophages via EVs. A‐C: In lipopolysaccharide (LPS)‐treated intestinal epithelial cell line Caco‐2. (A) mRNA levels of FTH1 detected by RT‐qPCR. (B) Protein levels of FTH detected by western blotting. (C) Secreted ferritin in culture medium, detected by ELISA assay. (D) Protein analysis of EVs purified by ultracentrifugation from culture medium of Caco‐2 cells after LPS stimulation for 24 h. EVs were resuspended with 100 µL PBS. Cell lysates (5/10 µg proteins) and EVs (5/10 µL PBS solution) were blotted for FTH, the exosomal positive markers ALIX and TSG101, and exosomal negative marker H3. (E) Representative electron microscopy images of EVs. Bar: 100 nm. (F) Diameter of EVs analysed by nanoparticle tracking system. (G) Scheme of Transwell and Dendra2 mean fluorescent intensity (MFI) detected by flow cytometry. Caco‐2 (Dendra2 or Dendra2‐FtH expression) cells were incubated in the upper chamber while RAW264.7 cells were seeded in the lower well. After LPS induction for 24 h, RAW264.7 cells were collected. (H) Representative images of Dendra2 fluorescence in RAW264.7 cells, which were co‐cultured with Caco‐2 cells expressing Dendra2 or Dendra2‐FtH, pretreated with GW4869 and/or LPS as indicated for 24 h. CTRL group means RAW264.7 cells only without co‐culture. Bar: 50 µm. (I) Diagram of the in vivo experimental design. (J) Successful delivery of Dendra2‐FtH‐expressing plasmid through in vivo jetPEI to mouse IECs and FtH trafficking from IECs to macrophages detected by western blotting and immunofluorescence, respectively. Macrophages were labelled with F4/80 (red); nuclei were labelled with DAPI (blue). Bar: 100 µm. Values are shown as mean ± SEM. t‐test was used for the comparison between the two groups. One‐way ANOVA was utilized for the comparison among more than 3 groups. Lipopolysaccharide (LPS, 1 µg/mL) was used to treat cells for 24 h. *p < 0.05, **p < 0.01, ***p < 0.001.
FIGURE 4
FIGURE 4
EV inhibitor GW4869 reduces ferritin transfer from IECs to macrophages. (A) C57BL/6 (WT) mice were given 2.5% DSS for 7 days and intraperitoneally injected with GW4869 in Days 0, 2, 4, 6. Experimental design schematic diagram and H&E and AB‐PAS staining of colon tissues. Bar: 200 µm. (B) FtHVil/Vil mice were overexpressed Dendra2‐FtH using in vivo jetPEI and given 2.5% DSS for 7 days. These mice were intraperitoneally injected with GW4869 in Days 0, 2, 4, 6. Experimental design schematic diagram and H&E and AB‐PAS staining of colon tissues. Bar: 200 µm. (C) Representative image of colon tissues and quantification of colonic length. (D) Weight loss. (E) Disease activity index. (F) Histopathological score. (G) Confocal images of the Dendra2‐FtH (green) and macrophage marker F4/80 (red) in colon tissues. Nuclei were labelled with DAPI (blue). Bar: 50 µm. (H) Heatmap of inflammatory genes expression levels detected by RT‐qPCR. Values are shown as mean ± SEM. t‐test was used for the comparison between the two groups. *p < 0.05, **p < 0.01, ***p < 0.001.
FIGURE 5
FIGURE 5
EVs from IECs trigger inflammation and oxidative stress in macrophages. Caco‐2 cells were stimulated with/without LPS and their EVs were collected (CTRL‐EV/LPS‐EV). RAW264.7 cells were treated with the EVs. (A) Cell morphology observed by microscope. (B) Levels of inflammation‐ and oxidative stress‐associated proteins, detected by western blotting. (C) Secreted IL‐18 detected by ELISA assays. (D) mRNA levels of Il‐1b and Il‐6 detected by RT‐qPCR. (E) ROS levels indicated by DCFH‐DA using flow cytometry and the quantification of mean fluorescence intensity. (F) The expression levels of M1/M2 phenotype markers detected by RT‐qPCR. (G–I) RAW264.7 cells were treated with same quantity of EVs from LPS‐stimulated Caco‐2 cells with/without removal of FtH (LPS‐EV/Ft(‐)LPS‐EV). (G) The protein levels of FTH in LPS‐EVs and Ft(‐)LPS‐EVs and corresponding quantification. (H) Levels of inflammation‐ and oxidative stress‐associated proteins in RAW264.7 cells detected by western blotting. (I) Heatmap for relative mRNA levels of inflammatory genes in RAW264.7 cells detected by RT‐qPCR. Values are shown as mean ± SEM. t‐test was used for the comparison between the two groups. One‐way ANOVA was utilized for the comparison among 3 groups. *p < 0.05, **p < 0.01, ***p < 0.001.
FIGURE 6
FIGURE 6
Uptake of iron‐loaded ferritin promotes oxidative stress and inflammation in macrophages. (A) Protein levels of FTH in EVs from Caco‐2 with/without LPS stimulation detected by western blotting. (B) Iron contents of EVs from Caco‐2 with/without LPS stimulation detected by ferrozine assays. (C) Ferritin iron staining for EVs from CTRL/LPS‐treated Caco‐2 cells. PC: positive control, commercial iron containing horse ferritin. (D) Uptake efficiency of Cy5‐labelled iron‐loaded ferritin (Holo‐Ft) and iron‐free ferritin (Apo‐Ft) by RAW264.7 cells using flow cytometry and the quantification of the mean fluorescent intensity. (E–J) RAW264.7 cells were treated with ferric ammonium citrate (FAC), iron‐loaded ferritin (Holo‐Ft), and iron‐free ferritin (Apo‐Ft). (E) Levels of iron metabolism, inflammation and oxidative stress‐associated proteins detected by western blotting. (F) Levels of cytosolic labile iron pool. (G) Cytosolic iron contents detected by Ferro Orange probe and the quantification of the relative fluorescence intensity. Bar: 50 µm. (H) ROS levels detected by DCFH‐DA using flow cytometry and the quantification of the mean fluorescence intensity. (I) Malondialdehyde (MDA) levels. (J) mRNA levels of Il‐6, Nlrp3 and Tnfα detected by RT‐qPCR. (K) mRNA levels of M1/M2 phenotype markers detected by RT‐qPCR. Values are shown as mean ± SEM. t‐test was used for the comparison between the two groups. One‐way ANOVA was utilized for the comparison among 3 groups. *p < 0.05, **p < 0.01, ***p < 0.001.
FIGURE 7
FIGURE 7
MSR1 is crucial for the ferritin uptake of macrophages. (A) The volcano plot of differentially expressed genes between LPS‐EV and CTRL‐EV group RAW264.7 cells from transcriptomics in this study. (B) MSR1 mRNA levels in colon mucosa from ulcerative colitis patients and healthy controls. The raw data were from GEO profile GDS3119. (C) MSR1 mRNA levels in intestinal sections from IBD patients collected in this study and DSS‐induced colitis mice, detected by RT‐qPCR. D‐E: Correlation of MSR1 and FTH1 in (D) whole blood and (E) colon. The raw data were from GEPIA database. (F) Representative images and quantification of Msr1 protein levels in RAW264.7 cells treated with EVs from Caco‐2 cells stimulated with LPS (LPS‐EVs) or FtH depleted EVs (Ft(‐) LPS‐EVs). (G–J) Intestinal samples from IBD patients: (G) MSR1 protein levels and the quantification. (H) Representative images of immunohistochemistry for MSR1. Bar: 100 µm. (I) Co‐localization of MSR1 and macrophages. The macrophages were labelled with CD68 and the nuclei were labelled with DAPI. Bar: 100 µm. (J) Confocal images of the FTH (green) and MSR1 (red) in intestinal sections from IBD patients. Nuclei were labelled with DAPI (blue). Bar: 100 µm. Values are shown as mean ± SEM. t‐test was used for the comparison between two groups. One‐way ANOVA was utilized for the comparison among 3 groups. *p < 0.05, **p < 0.01, ***p < 0.001.
FIGURE 8
FIGURE 8
MSR1 is crucial for the EVs internalization to bring ferritin into the macrophages. (A) Confocal images of the Dendra2 (green) and Msr1 (purple) in WT or Msr1 KD RAW264.7 cells, treated with EVs from Dendra2‐FtH expressing Caco‐2 cells. EVs were labelled with fluorescent probe PKH26 (red). Nuclei were labelled with DAPI (blue). Bar: 10 µm. (B) Confocal images of the Dendra2 (green) and Msr1 (purple) in RAW264.7 cells, treated with EVs from Dendra2‐FtH‐ expressing Caco‐2 cells, with/without fucoidan treatment. EVs were labelled with fluorescent probe PKH26 (red). Nuclei were labelled with DAPI (blue). Bar: 20 µm. (C) Confocal images of EGFP‐Msr1 (green) and EVs (red) in Msr1 KD RAW264.7 cells, following transfection with pEGFP‐Msr1 plasmid and treatment with PKH26‐labelled EVs. Nuclei were labelled with DAPI (blue). Bar: 10 µm.
FIGURE 9
FIGURE 9
MSR1 antagonist fucoidan mitigates the severity of IBD in DSS‐induced colitis mice. C57BL/6J wildtype mice were given 2.5% DSS drinking water and intraperitoneally injected with fucoidan every day for 7 days. N = 6/group. (A) Representative images of colon and quantification of the length of colon. (B) Body weight. (C) mRNA levels of inflammatory genes in colon tissues detected by RT‐qPCR. (D) Representative images of H&E‐stained and 4‐HNE‐stained colon tissues. Bar: 100 µm. (E) FtH and Msr1 protein levels in colon tissue. (F) Representative confocal images in colon tissues. F4/80 is in red, Msr1 in green, and nuclei in blue. Bar: 20 µm. (G) Confocal images showing less FtH in macrophages after fucoidan treatment. Macrophages were labelled in red, FtH in green, nuclei in blue. Bar: 50 µm. Values are shown as mean ± SEM. t‐test was used for the comparison between the two groups. One‐way ANOVA was utilized for the comparison among more than 3 groups. *p < 0.05, **p < 0.01, ***p < 0.001, ns: no significance.

Similar articles

References

    1. Akhuemonkhan, E. , Parian A., Miller K., Hanauer S., and Hutfless S.. 2017. “Prevalence and Screening for Anaemia in Mild to Moderate Crohn's Disease and Ulcerative Colitis in the United States, 2010–2014.” BMJ Open Gastroenterol 4, no. 1: e000155. - PMC - PubMed
    1. Arosio, P. , Ingrassia R., and Cavadini P.. 2009. “Ferritins: a family of Molecules for Iron Storage, Antioxidation and More.” Biochimica Et Biophysica Acta 1790, no. 7: 589–599. - PubMed
    1. Brown, C. W. , Amante J. J., Chhoy P., et al. 2019. “Prominin2 Drives Ferroptosis Resistance by Stimulating Iron Export.” Developmental Cell 51, no. 5: 575–586 e574. - PMC - PubMed
    1. Cacoub, P. , Choukroun G., Cohen‐Solal A., et al. 2022. “Iron Deficiency Screening Is a Key Issue in Chronic Inflammatory Diseases: A Call to Action.” Journal of Internal Medicine 292, no. 4: 542–556. - PMC - PubMed
    1. Carrier, J. , Aghdassi E., Cullen J., and Allard J. P.. 2002. “Iron Supplementation Increases Disease Activity and Vitamin E Ameliorates the Effect in Rats With Dextran Sulfate Sodium‐Induced Colitis.” Journal of Nutrition 132, no. 10: 3146–3150. - PubMed

MeSH terms

LinkOut - more resources