. 2025 Sep;12(34):e00421.
doi: 10.1002/advs.202500421. Epub 2025 Jun 23.

MYC/TET3-Regulated TMEM65 Activates OXPHOS-SERPINB3 Pathway to Promote Progression and Cisplatin Resistance in Triple-Negative Breast Cancer

Affiliations

MYC/TET3-Regulated TMEM65 Activates OXPHOS-SERPINB3 Pathway to Promote Progression and Cisplatin Resistance in Triple-Negative Breast Cancer

Yin-Ling Zhang et al. Adv Sci (Weinh). 2025 Sep.

Abstract

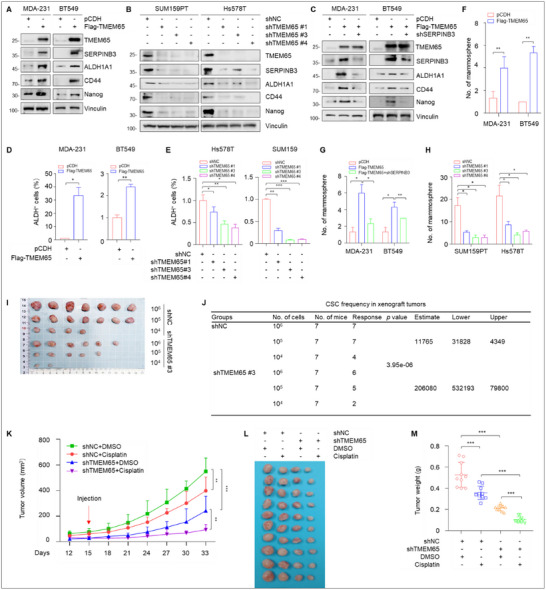
Triple-negative breast cancer (TNBC) is the most lethal subtype of breast cancer due to its aggressive clinical features and the lack of effective targeted therapeutics. Mitochondrial metabolism is intimately linked to TNBC progression and therapeutic resistance and is an attractive therapeutic target for TNBC. Here, it is first reported that human transmembrane protein 65 (TMEM65), a poorly characterized mitochondrial inner-membrane protein-encoding gene in human cancer, acts as a novel oncogene in TNBC to promote tumor growth, metastasis, and cisplatin resistance both in vivo and in vitro. Transcription factor MYC and DNA demethylase ten-eleven translocation 3 (TET3) coordinately upregulate TMEM65 in TNBC, and its upregulation is associated with poor patient survival. Moreover, pharmacological inhibition or knockdown of MYC and TET3 attenuates TMEM65-driven TNBC progression. Mechanistic investigations reveal that TMEM65 enhances mitochondrial oxidative phosphorylation and its byproduct reactive oxygen species (ROS) production. Increased ROS induces the expression of hypoxia-inducible factor 1α (HIF1α), which in turn transcriptionally activates serpin family B member 3 (SERPINB3) to enhance TNBC stemness, thus leading to TNBC progression and cisplatin resistance. Collectively, these findings identify TMEM65 as a vital oncogene of TNBC, unveil its regulatory mechanisms, and shed light on its potential role in TNBC therapy.

Keywords: cancer stemness; chemoresistance; mitochondrial metabolism; transmembrane protein; triple‐negative breast cancer.


Conflict of interest statement

The authors declare no conflict of interest.

Figures

Figure 1
Figure 1
TMEM65 is aberrantly upregulated in TNBC tissues and its high expression predicts poor prognosis of TNBC patients. A) The schematic diagram for screening mitochondrial inner‐membrane (MIM)‐related genes in TNBC progression. TMEM65 protein contains three transmembrane (TM) domains. N, normal. B, C) The mRNA levels of TMEM65 in 360 TNBC tissues and 88 normal controls from the FUSCC‐TNBC dataset of RNA‐Seq.[ 21 ] D, E) The protein levels of TMEM65 in 90 TNBC tissues and 72 normal controls from the FUSCC‐TNBC dataset of quantitative proteomics.[ 20 ] F, G) Immunoblotting detection of TMEM65 protein expression levels in 10 pairs of primary TNBC specimens and adjacent normal tissues (F). The immunoblotting bands were quantified using ImageJ software, and the corresponding quantitative results are shown in G. H, I) The mRNA (H) and protein (I) levels of TMEM65 in all breast cancers from the TCGA (H) and CPTAC (I) datasets. J–L) The mRNA and protein levels of TMEM65 in all breast cancers from the CBCGA dataset.[ 27 ] M) The association of TMEM65 mRNA levels with relapse‐free survival (RFS) of TNBC patients in the Kaplan–Meier plotter dataset (https://www.kmplot.com/analysis/).
Figure 2
Figure 2
TMEM65 promotes TNBC cell proliferation, migration, and invasion in vitro and xenograft tumor growth and lung metastatic in vivo. A) Immunoblotting analysis of TMEM65 protein levels in 10 representative TNBC cell lines. B) Validation of the established MDA‐231 and BT549 cell lines stably expressing pCDH and Flag‐TMEM65 by immunoblotting. C) Validation of the established SUM159PT and Hs578T cell lines stably expressing shNC (negative‐control shRNA) and shTMEM65 (shRNA targeting TMEM65) by immunoblotting. D, E) MDA‐231 and BT549 cells stably expressing pCDH and Flag‐TMEM65 were subjected to CCK‐8 (D) and colony formation (E) assays. The representative images of survival colonies are shown in Figure S3A (Supporting Information). F, G) SUM159PT and Hs578T cells stably expressing shNC and shTMEM65 were subjected to CCK‐8 (F) and colony formation (G) assays. The representative images of survival colonies are shown in Figure S3B (Supporting Information). H–J) SUM159PT cells stably expressing shNC and shTMEM65 were injected into the mammary fat pad of female BALB/c nude mice to conduct xenograft tumor assays. Tumor growth rates were monitored for up to 26 days (H). The images of the collected xenograft tumors and tumor weight are shown in I and J, respectively. K, L) MDA‐231 and BT549 cells stably expressing pCDH and Flag‐TMEM65 were subjected to Transwell migration and invasion assays. The representative images of migrated and invaded cells are shown in Figure S3C (Supporting Information). M, N) SUM159PT and Hs578T cells stably expressing shNC and shTMEM65 were subjected to Transwell migration and invasion assays. The representative images of migrated and invaded cells are shown in Figure S3D (Supporting Information). O, P) SUM159PT cells stably expressing shNC and shTMEM65 were injected into the tail vein of female BALB/c nude mice to establish experimental lung metastasis models. The representative images of metastatic lung nodules and corresponding quantitative results are shown in O and P, respectively. The images of collected all lung tissues are shown in Figure S3E (Supporting Information).
Figure 3
Figure 3
Transcription factor MYC and DNA demethylase TET3 cooperate to transactivate TMEM65 in TNBC. A, B) TNBC cells with ectopic expression (A) or knockdown (B) of MYC were subjected to RT‐qPCR assays to detect the mRNA levels of TMEM65. C, D) HEK293T cells with ectopic expression (C) or knockdown (D) of MYC were subjected to double luciferase reporter assays to detect TMEM65 promoter activities. E, F) HEK293T cells were transfected with the indicated expression vectors and subjected to luciferase assays to detect TMEM65 promoter activities. G) Recruitment of MYC to TMEM65 promoter was detected by ChIP assays. H, I) MDA‐231 and BT549 cells stably expressing pLVX and Flag‐MYC were treated without (H) or with MYC inhibitor 10058‐F4 (I) and were subjected to an immunoblotting assay to detect the protein levels of TMEM65. J) SUM159PT and Hs578T cells stably expressing shNC and shMYC were subjected to immunoblotting assays to detect the protein levels of TMEM65. K) The correlation of expression levels between the DNA methylation‐related enzymes and TMEM65 in the TCGA dataset. L, M) SUM159PT and Hs578T cells were treated with or without increasing doses of TET inhibitor Bobcat339 for 24 h, and then subjected to immunoblotting (L) and RT‐qPCR (M) assays to detect the protein and mRNA levels of TMEM65. N, O) SUM159PT and Hs578T cells stably expressing shNC and shTET3 were subjected to immunoblotting (N) and RT‐qPCR (O) assays to detect the protein and mRNA levels of TMEM65. P, Q) MDA‐231 and BT549 cells stably expressing pLVX and Flag‐MYC were treated without or with TET inhibitor Bobcat339, and then subjected to immunoblotting assays to detect the protein levels of TMEM65.
Figure 4
Figure 4
Pharmacological inhibition or knockdown of MYC and TET3 decelerates TMEM65‐driven TNBC progression. A, B) MDA‐231 and BT549 cells stably expressing pCDH and Flag‐TMEM65 were treated with or without MYC inhibitor 10058‐F4 or TET inhibitor Bobcat339 alone or in combination, and then subjected to colony formation assays. The representative images of survival colonies and corresponding quantitative results are shown in A and B, respectively. C–E) MDA‐231 and BT549 cells stably expressing pCDH and Flag‐TMEM65 were treated with or without MYC inhibitor 10058‐F4 or TET inhibitor Bobcat339 alone or in combination, and then subjected to Transwell migration and invasion assays. The representative images of migrated and invaded cells (C) and corresponding quantitative results (D, E) are shown. F–H) MDA‐231 cells stably expressing Flag‐TMEM65, shMYC, and shTET3 alone or in combination were injected into the mammary fat pad of female BALB/c nude mice to conduct xenograft tumor assays. Tumor growth rates were monitored for up to 30 days (F). The images of the collected xenograft tumors and tumor weight are shown in G and H, respectively.
Figure 5
Figure 5
TMEM65 transactivates the oncogene SERPINB3 by activating the OXPHOS‐ROS‐HIF1α pathway. A) SUM159PT cells stably expressing shNC and shTMEM65 were subjected to label‐free quantitative proteomic assays. The top 10 down‐regulated proteins following the knockdown of TMEM65 are shown. B, C) Immunoblotting analysis of SERPINB3 protein expression levels under the conditions of ectopic expression (B) or knockdown (C) of TMEM65. D, E) The oxygen consumption rate (OCR) was determined in TNBC cells with ectopic expression (D) or knockdown (E) of TMEM65. F, G) Immunoblotting analysis of HIF1α protein expression levels in TNBC cells with ectopic expression (F) or knockdown (G) of TMEM65. H) MDA‐231 and BT549 cells stably expressing pCDH and Flag‐TMEM65 were treated with or without ROS inhibitor NAC for 48 h, and then subjected to immunoblotting assays to detect SERPINB3 protein expression levels. I) MDA‐231 and BT549 cells stably expressing pCDH, Flag‐TMEM65, and shHIF1α alone or in combination were subjected to immunoblotting assays to detect SERPINB3 protein expression levels. J–L) HEK293T cells were transfected with the indicated expression vectors and subjected to luciferase assays to detect TMEM65 promoter activities. M) Recruitment of HIF1α to SERPINB3 promoter was determined by ChIP assays.
Figure 6
Figure 6
TMEM65 promotes TNBC progression partially via regulating SERPINB3. A, B) SUM159PT and Hs578T cells stably expressing shNC, shMYC, and HA‐SERPINB3 alone or in combination were subjected to colony formation assays. The representative images of survival colonies and corresponding quantitative results are shown in A and B, respectively. C–F) SUM159PT and Hs578T cells stably expressing shNC, shMYC, and HA‐SERPINB3 alone or in combination were subjected to Transwell migration (C, D) and invasion (E, F) assays. The representative images of migrated and invaded cells (C, E) and corresponding quantitative results (D. F) are shown. G–I) SUM159PT cells stably expressing shNC, shMYC, and HA‐SERPINB3 alone or in combination were subjected to mouse xenograft tumor assays. Tumor growth rates were monitored for up to 30 days (G). The images of the collected xenograft tumors and tumor weight are shown in H and I, respectively.
Figure 7
Figure 7
TMEM65 promotes TNBC stemness and cisplatin resistance both in vitro and in vivo. A, B) TNBC cells with ectopic expression (A) or knockdown (B) of TMEM65 were subjected to immunoblotting assays to detect the protein levels of SERPINB3 and putative CSC markers. C) MDA‐231 and BT549 cells stably expressing pCDH, Flag‐TMEM65, and shSERPINB3 alone or in combination were subjected to immunoblotting assays to detect the protein levels of SERPINB3 and putative CSC markers. D, E) TNBC cells with ectopic expression (D) or knockdown (E) of TMEM65 were subjected to ALDEFLUOR assays to detect the proportion of the putative CSC marker ALDH1‐positive cells. F, G) MDA‐231 and BT549T cells with ectopic expression of TMEM65 alone (F) or in combination with knockdown of SERPINB3 (G) were subjected to mammosphere assays to detect the sphere formation ability. H) SUM159PT and Hs578T cells with knockdown of TMEM65 were subjected to mammosphere assays to detect the sphere formation ability. I, J) SUM159PT cells stably expressing shNC and shTMEM65 were subjected to in vivo limiting dilution transplantation assays. The frequency of breast CSCs was calculated based on the positive tumor sites per group using ELDA (extreme limiting dilution analysis) software (http://bioinf.wehi.edu.au/software/elda/). K–M) SUM159PT cells stably expressing shNC and shTMEM65 were inoculated into the mammary fat pads of 6‐week‐old BALB/c female nude mice. After 15 days of injection, DMSO or cisplatin (3 mg kg−1) was administered to mice by intraperitoneal injection twice a week for 2 weeks. Tumor growth rates, the images of the collected xenograft tumors, and tumor weight are shown in K–M, respectively.

References

    1. Foulkes W. D., Smith I. E., Reis‐Filho J. S., N. Engl. J. Med. 2010, 363, 1938. - PubMed
    1. Bianchini G., Balko J. M., Mayer I. A., Sanders M. E., Gianni L., Nat. Rev. Clin. Oncol. 2016, 13, 674. - PMC - PubMed
    1. Poggio F., Bruzzone M., Ceppi M., Pondé N. F., La Valle G., Del Mastro L., de Azambuja E., Lambertini M., Ann. Oncol. 2018, 29, 1497. - PubMed
    1. Zhu Y., Hu Y., Tang C., Guan X., Zhang W., Biochim. Biophys. Acta Rev. Cancer 2022, 1877, 188678. - PubMed
    1. Wang B., Zhao Y., Li Y., Xu Y., Chen Y., Jiang Q., Yao D., Zhang L., Hu X., Fu C., Zhang S., Chen S., Mol. Cancer 2022, 21, 22. - PMC - PubMed

MeSH terms

LinkOut - more resources