. 2025 Jun;31(6):e70480.
doi: 10.1111/cns.70480.

Buyang Huanwu Decoction Modulates the Gut Microbiota-C/EBPβ/AEP Axis to Ameliorate Cognitive Impairment in Alzheimer's Disease Mice

Affiliations

Buyang Huanwu Decoction Modulates the Gut Microbiota-C/EBPβ/AEP Axis to Ameliorate Cognitive Impairment in Alzheimer's Disease Mice

Junyi Liang et al. CNS Neurosci Ther. 2025 Jun.

Abstract

Background: Alzheimer's disease (AD) is a progressive neurodegenerative disorder characterized by cognitive decline and behavioral disturbances. Buyang Huanwu Decoction (BYHWD), a traditional Chinese herbal formulation, has demonstrated potential neuroprotective effects. This study aims to evaluate the therapeutic impact of BYHWD on cognitive impairments in 3×Tg mice and to investigate its underlying mechanism through modulation of the gut microbiota-C/EBPβ/AEP signaling pathway.

Methods: In two independent experiments, we assessed the effects of BYHWD and its derived fecal microbiota transplantation (FMT-BYHWD) on behavioral performance, neuropathological alterations, and signaling pathways in 3×Tg mice.

Results: Treatment with BYHWD significantly improved cognitive function in 3×Tg mice and mitigated AD-like pathological changes. By suppressing the C/EBPβ/AEP signaling pathway, BYHWD reduced pathological Aβ plaque deposition, diminished tau hyperphosphorylation, and inhibited the release of pro-inflammatory cytokines. Further analysis revealed that BYHWD restored gut microbiota balance and suppressed the activation of the C/EBPβ/AEP pathway in the hippocampus. Moreover, transplanting FMT-BYHWD from BYHWD-treated mice to germ-free 3×Tg mice also ameliorated their cognitive deficits and AD-like pathology, suggesting that the anti-AD effects of BYHWD are mediated through the gut-brain axis by regulating the interplay between gut microbiota and the C/EBPβ/AEP signaling pathway.

Conclusion: This study uncovers the mechanism by which BYHWD improves cognitive deficits and neuropathological changes in 3×Tg mice via the gut-brain axis, mediated by the modulation of the gut microbiota-C/EBPβ/AEP signaling pathway, providing a novel therapeutic strategy for AD.

Keywords: AEP; Alzheimers disease; Buyang Huanwu decoction; C/EBPβ; amyloid‐β; gut microbiota.


Conflict of interest statement

The authors declare no conflicts of interest.

Figures
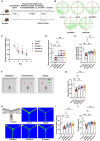
FIGURE 1
FIGURE 1
BYHWD ameliorates behavioral deficits and cognitive impairments in 3×Tg mice. (A) Experimental timeline and schematic illustrating the first phase of the study. (B) Representative swimming trajectories from the Morris water maze task, used to assess spatial learning and memory in 3×Tg mice. (C) Escape latency across the four training days (Days 1–4) in the Morris water maze test, reflecting spatial memory acquisition. Data are shown as mean ± SD (n = 8). (D) Number of platform crossings during the probe trial of the Morris water maze, indicating memory retention and the ability to recall the learned platform location. (E) Time spent in the target quadrant during the probe trial, reflecting spatial memory performance, and retention. (F) Schematic of the novel object recognition test, assessing non‐spatial memory in 3×Tg mice. (G) Recognition index calculated from the time spent exploring the novel object versus the familiar object during the novel object recognition test. (H) Representative heatmaps showing exploration behavior in the Y‐maze, reflecting preference for the novel arm as an indicator of working memory and cognitive flexibility. (I) Percentage of correct alternations in the Y‐maze, measuring working memory and cognitive flexibility. (J) Novelty index in the Y‐maze, quantifying preference for the novel arm as an indicator of exploratory behavior and memory. Data are presented as mean ± SEM (n = 8) unless otherwise specified. Normality was assessed using the Shapiro–Wilk test, and variance homogeneity was tested by Bartlett's test. Statistical significance was assessed using one‐way ANOVA with Dunnett's post hoc test (D, E, G, I, J) and two‐way ANOVA with Bonferroni's post hoc test (C). Statistical significance was determined as *p < 0.05; **p < 0.01; ***p < 0.001.
FIGURE 2
FIGURE 2
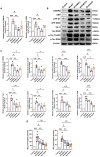
BYHWD suppresses the C/EBPβ‐AEP pathway and reduces Aβ burden in 3×Tg mice. (A) qPCR analysis of hippocampal Cebpb and Lgmn mRNA expression (n = 3). (B) Representative immunoblots of C/EBPβ, AEP, APP NT, APP N585, Tau5, Tau N368, and phosphorylated Tau (p‐Tau Thr205 and p‐Tau S396) in the hippocampus. (C) Densitometric quantification of immunoblots shown in (B) (n = 4). (D) ELISA quantification of hippocampal Aβ40 and Aβ42 levels (n = 8). Data are presented as mean ± SEM. Normality was assessed using the Shapiro–Wilk test, and variance homogeneity was tested by Bartlett's test. Statistical significance was assessed using one‐way ANOVA with Dunnett's post hoc test (A, C) or Dunnett T3 test for unequal variances (D). Statistical significance was determined as *p < 0.05; **p < 0.01; ***p < 0.001.
FIGURE 3
FIGURE 3
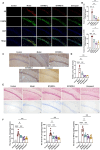
BYHWD attenuates C/EBPβ‐mediated Aβ and Tau pathology and reduces neuroinflammation in 3×Tg mice. (A) Immunofluorescence staining of Aβ (red) and C/EBPβ (green) in hippocampal sections (200×, scale bar = 50 μm). (B) Quantification of Aβ and C/EBPβ fluorescence intensity (n = 4). (C) Immunohistochemical detection of p‐Tau in the hippocampus (200×, scale bar = 100 μm). (D) Quantification of p‐Tau expression from (C) (n = 3). (E) H&E and Nissl staining showing histopathological alterations in the CA1 region (200×, scale bar = 100 μm). (F) ELISA quantification of hippocampal IL‐1β, IL‐6, and TNF‐α levels (n = 8). Data are presented as mean ± SEM. Normality was assessed using the Shapiro–Wilk test, and variance homogeneity was tested by Bartlett's test. Statistical significance was assessed using one‐way ANOVA with Dunnett's post hoc test (B) or Dunnett T3 test for unequal variances (D, F). Statistical significance was determined as *p < 0.05; **p < 0.01; ***p < 0.001.
FIGURE 4
FIGURE 4
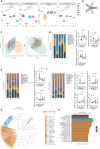
BYHWD restores gut microbiota diversity and composition in 3×Tg mice. (A) Alpha diversity indices (Chao1, Observed species, Shannon, Simpson) indicating microbial richness and diversity across groups (n = 6). (B) Venn diagram displaying shared and unique OTUs across groups. (C) Principal coordinates analysis (PCoA) and non‐metric multidimensional scaling (NMDS) revealing compositional differences in microbial communities. (D–F) Relative abundance of gut microbiota at the phylum (D), family (E), and genus (F) levels. (G, H) Linear discriminant analysis (LDA) identifying taxa differentially enriched between groups. Data are presented as median with interquartile range (IQR) for violin plots and box plots. Diversity indices (Chao1, Observed species, Shannon, Simpson) were calculated, and statistical differences were assessed using the Kruskal–Wallis test with Dunn's post hoc test for pairwise comparisons (A). Beta diversity was assessed using the UniFrac distance metric, with visualization by PCoA and NMDS (C). Normality was tested using the Shapiro–Wilk test, followed by one‐way ANOVA for normally distributed data and the Kruskal–Wallis test for non‐normally distributed data (D–F). Taxonomic composition at the phylum, family, and genus levels was analyzed and visualized using QIIME2‐generated histograms (D–F). *p < 0.05; **p < 0.01; ***p < 0.001.
FIGURE 5
FIGURE 5
FMT‐BYHWD ameliorates behavioral and cognitive impairments in 3×Tg mice. (A) Experimental timeline and schematic illustrating the second phase of the study. (B) Representative swimming trajectories from the Morris water maze probe trial. (C) Escape latency across the four training days (Days 1–4) in the Morris water maze test, reflecting spatial memory acquisition. Data are shown as mean ± SD (n = 8). (D) Number of platform crossings during the Morris water maze probe trial, indicating spatial memory retention. (E) Time spent in the target quadrant during the Morris water maze probe trial, assessing memory performance. (F) Recognition index calculated from exploration time of the novel versus familiar object in the novel object recognition test. (G) Representative heatmaps showing exploration behavior in the Y‐maze, reflecting preference for the novel arm as an indicator of working memory and cognitive flexibility. (H) Percentage of correct alternations in the Y‐maze, measuring working memory and cognitive flexibility. (I) Novelty index in the Y‐maze, quantifying preference for the novel arm as an indicator of exploratory behavior and memory. Data are presented as mean ± SEM (n = 8) unless otherwise specified. Normality was assessed using the Shapiro–Wilk test, and variance homogeneity was tested by Bartlett's test. Statistical significance was assessed using one‐way ANOVA with Dunnett's post hoc test (D–F, H, I) and two‐way ANOVA with Bonferroni's post hoc test (C). Statistical significance was determined as *p < 0.05; **p < 0.01; ***p < 0.001.
FIGURE 6
FIGURE 6
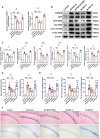
FMT‐BYHWD suppresses the C/EBPβ‐AEP pathway, attenuates Aβ and Tau pathology, and reduces neuroinflammation in 3×Tg mice. (A) qPCR analysis of hippocampal Cebpb and Lgmn mRNA expression (n = 3). (B) Representative immunoblots of C/EBPβ, AEP, APP N585, Tau N368, and phosphorylated Tau (p‐Tau Thr205 and p‐Tau S396) in the hippocampus. (C) Densitometric quantification of immunoblots shown in (B) (n = 4). (D) ELISA quantification of hippocampal Aβ40 and Aβ42 levels (n = 8). (E) ELISA analysis of hippocampal IL‐1β, IL‐6, and TNF‐α levels (n = 8). (F) Representative images of HE and Nissl staining showing histopathological alterations in the CA1 region of the hippocampus (200×, scale bar = 100 μm). Data are presented as mean ± SEM. Normality was assessed using the Shapiro–Wilk test, and variance homogeneity was tested by Bartlett's test. Statistical significance was assessed using one‐way ANOVA with Dunnett's post hoc test (A, C) or Dunnett T3 test for unequal variances (D, E). Statistical significance was determined as *p < 0.05; **p < 0.01; ***p < 0.001.

Similar articles

References

    1. Alzheimer's Association , “2024 Alzheimer's Disease Facts and Figures,” Alzheimer's & Dementia 20, no. 5 (2024): 3708–3821. - PMC - PubMed
    1. Lauwers E., Lalli G., Brandner S., et al., “Potential Human Transmission of Amyloid β Pathology: Surveillance and Risks,” Lancet Neurology 19, no. 10 (2020): 872–878. - PubMed
    1. Collins S. M., Surette M., and Bercik P., “The Interplay Between the Intestinal Microbiota and the Brain,” Nature Reviews Microbiology 10, no. 11 (2012): 735–742. - PubMed
    1. van der Kant R., Goldstein L. S. B., and Ossenkoppele R., “Amyloid‐β‐Independent Regulators of Tau Pathology in Alzheimer Disease,” Nature Reviews Neuroscience 21, no. 1 (2020): 21–35. - PubMed
    1. Junyi L., Yueyang W., Bin L., et al., “Gut Microbiota Mediates Neuroinflammation in Alzheimer's Disease: Unraveling Key Factors and Mechanistic Insights,” Molecular Neurobiology 62, no. 3 (2025): 3746–3763. - PubMed

MeSH terms

Substances