. 2025 Jun 6:15:1579558.
doi: 10.3389/fcimb.2025.1579558. eCollection 2025.

A machine learning model for robust prediction of sepsis-induced coagulopathy in critically ill patients with sepsis

Affiliations

A machine learning model for robust prediction of sepsis-induced coagulopathy in critically ill patients with sepsis

Jia Sun et al. Front Cell Infect Microbiol. .

Abstract

Introduction: Sepsis-induced coagulopathy (SIC) is a common disease in patients with sepsis. It denotes higher mortality rates and a poorer prognosis in these patients. This study aimed to develop a practical machine learning (ML) model for the prediction of the risk of SIC in critically ill patients with sepsis.

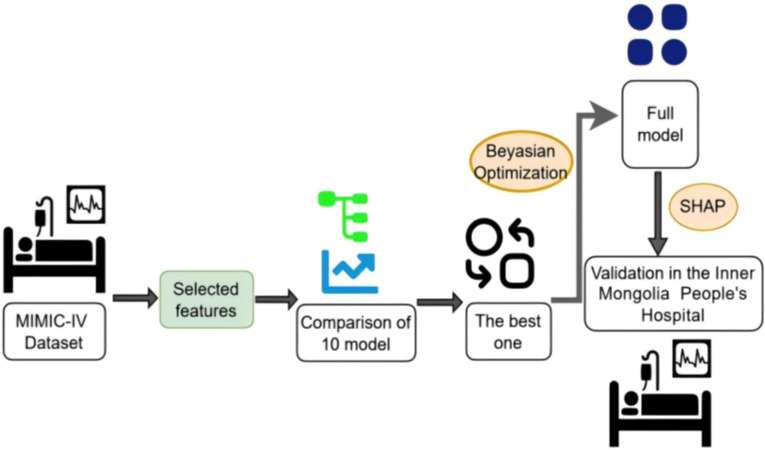
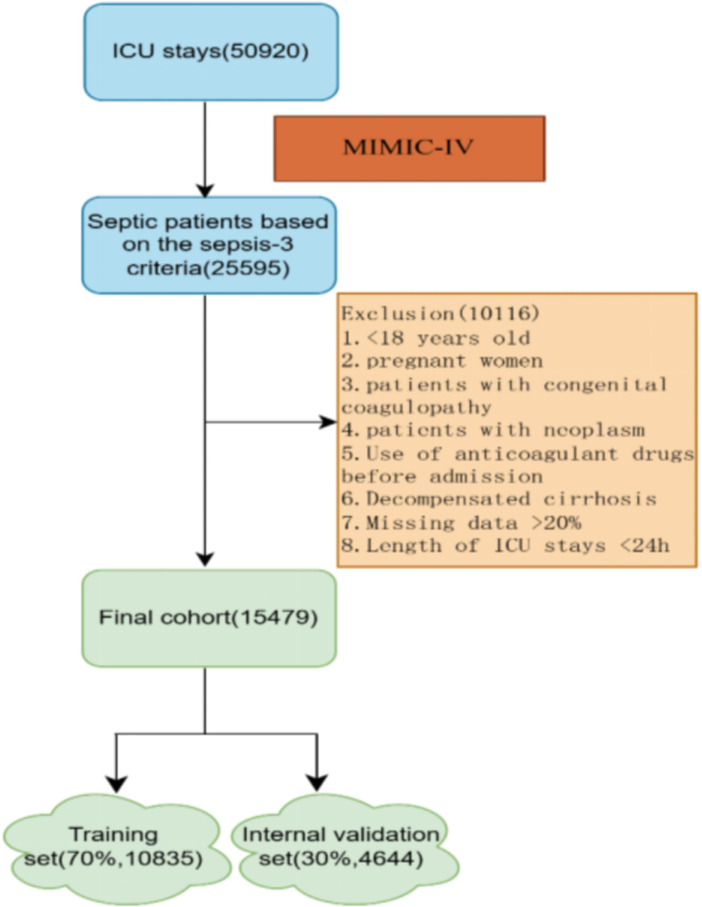
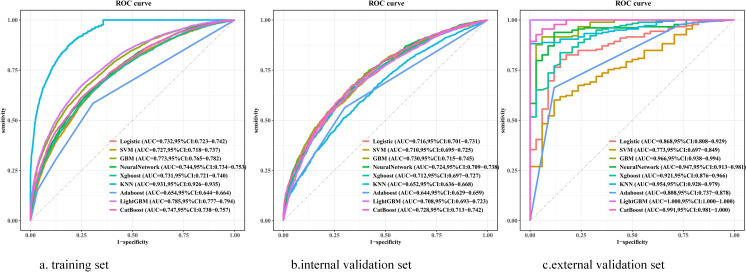
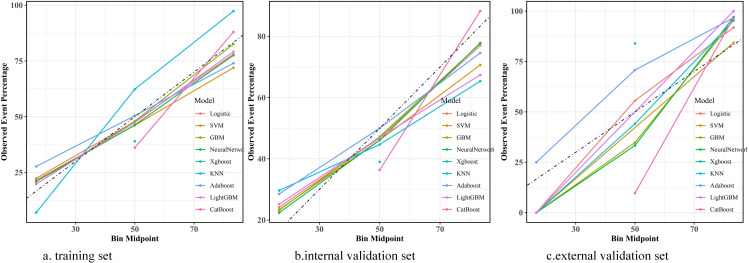
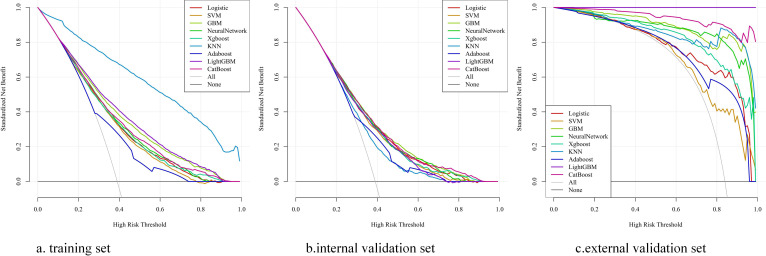
Methods: In this retrospective cohort study, patients were extracted from the Medical Information Mart for Intensive Care IV (MIMIC-IV) database and the Inner Mongolia Autonomous Region People's Hospital database. Sepsis and SIC were defined based on the Sepsis-3 criteria and the criteria developed based on the International Society of Thrombosis and Haemostasis (ISTH), respectively. We compared nine ML models using the Sequential Organ Failure Assessment (SOFA) score in terms of SIC prediction ability. Optimal model selection was based on the superior performance metrics exhibited by the model on the training dataset, the internal validation dataset, and the external validation dataset.

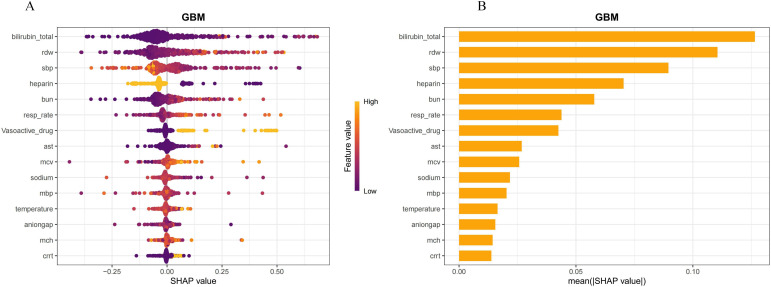
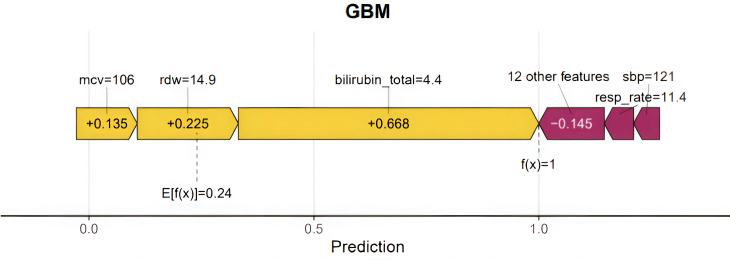
Results: Of the 15,479 patients in MIMIC-IV included in the final cohort, a total of 6,036 (38.9%) patients developed SIC during sepsis. We selected 17 features to construct ML prediction models. The gradient boosting machine (GBM) model was deemed optimal as it achieved high predictive accuracy and reliability across the training, internal, and external validation datasets. The areas under the curve of the GBM model were 0.773 (95%CI = 0.765-0.782) in the training dataset, 0.730 (95%CI = 0.715-0.745) in the internal validation dataset, and 0.966 (95%CI = 0.938-0.994) in the external validation dataset. The Shapley Additive Explanations (SHAP) values illustrated the prediction results, indicating that total bilirubin, red cell distribution width (RDW), systolic blood pressure (SBP), heparin, and blood urea nitrogen (BUN) were risk factors for progression to SIC in patients with sepsis.

Conclusions: We developed an optimal and operable ML model that was able to predict the risk of SIC in septic patients better than the SOFA scoring models.

Keywords: machine learning; predict; risk factor; sepsis; sepsis-induced coagulopathy.


Conflict of interest statement

The authors declare that the research was conducted in the absence of any commercial or financial relationships that could be construed as a potential conflict of interest.

Figures

Figure 1
Figure 1
Framework of the prediction model. A total of 17 variables were selected through feature selection in the Medical Information Mart for Intensive Care-IV (MIMIC-IV) database. We compared the discrimination of nine machine learning models using 10-fold cross-validation. The model with the best overall performance was selected. Fine-grained hyperparameter adjustment was performed using Bayesian optimization. The Shapley Additive Explanations (SHAP) values were used to explain the output of the full model. This full model was validated in the Inner Mongolia People’s Hospital.
Figure 2
Figure 2
Flowchart of the patient selection.
Figure 3
Figure 3
Receiver operating characteristic curves shows the predictive performance of nine machine learning models in predicting the risk factors of SIC. (A) Receiver Operating Characteristic curves of various models on the training set. (B) Receiver Operating Characteristic curves of various models on the internal validation dataset. (C) Receiver Operating Characteristic curves of various models on the external validation dataset. Logistic, logistic regression; SVM, support vector machine; GBM, gradient boosting machine; Neural Network, artificial neural network; XGBoost, eXtreme gradient boosting; KNN, k-nearest neighbors; Adaboost, adaptive boosting; LightGBM, light gradient boosting machine; CatBoost, categorical boosting; AUC, area under the receiver operating characteristic curve; 95%CI, 95% confidence interval.
Figure 4
Figure 4
Calibration curves of the nine prediction models across different datasets. (A) Performance of the models on the training set. (B) Results on the internal validation dataset. (C) Assessment outcomes on the external validation dataset. Logistic, logistic regression; SVM, support vector machine; GBM, gradient boosting machine; Neural Network, artificial neural network; XGBoost, eXtreme gradient boosting; KNN, k-nearest neighbors; Adaboost, adaptive boosting; LightGBM, light gradient boosting machine; CatBoost, categorical boosting.
Figure 5
Figure 5
The Decision Curve Analysis (DCA) graph is utilized to compare the clinical utility of various machine learning models in predicting the risk factors for SIC. (A) Decision curve analysis of various models on the training set. (B) Decision curve analysis of various models on the internal validation dataset. (C) Decision curve analysis of various models on the external validation dataset. Logistic, logistic regression; SVM, support vector machine; GBM, gradient boosted models; Neural Network, artificial neural network; XGBoost, eXtreme gradient boosting; KNN, k-nearest neighbors; Adaboost, adaptive boosting; LightGBM, light gradient boosting machine; CatBoost, categorical boosting.
Figure 6
Figure 6
Interpretation of the generalized boosted model (GBM). (A) Feature importance ranking based on the Shapley Additive Explanations (SHAP) values. The position on the y-axis implies the importance ranking, while the x-axis reflects the association between each feature value and the corresponding SHAP value. (B) Importance ranking of the included features according to the mean (|SHAP value|). RDW, red blood cell distribution width; SBP, systolic blood pressure; MBP, mean arterial pressure; BUN, blood urea nitrogen; resp_rate, respiration rate; MCH, mean corpuscular hemoglobin; AST, aspartate aminotransferase; CRRT, continuous renal replacement therapy.
Figure 7
Figure 7
The notation f(x) = 1 represents the predicted value of the model for a specific instance or sample. E[f(x)] = 0.24 denotes the average predicted value, or the expected value, of the model across the dataset. The bars in yellow and red represent the risk factors and the protective factors, respectively; longer bars denote greater feature importance. Here, these values are the model outputs before the SoftMax layer and, therefore, are not equal to the final predicted probabilities. This figure shows the explanation for a high-risk instance. RDW, red blood cell distribution width; SBP, systolic blood pressure; MBP, mean arterial pressure; BUN, blood urea nitrogen; resp_rate, respiration rate; MCH, mean corpuscular hemoglobin; AST, aspartate aminotransferase; CRRT, continuous renal replacement therapy.

Similar articles

References

    1. Collins G. S., Reitsma J. B., Altman D. G., et al. (2015). Transparent reporting of a multivariable prediction model for individual prognosis or diagnosis (TRIPOD): the TRIPOD statement. BMJ 13, 1. doi: 10.1186/s12916-014-0241-z - DOI - PMC - PubMed
    1. Fleischmann-Struzek C., Mellhammar L., Rose N., et al. (2020). Incidence and mortality of hospital- and ICU-treated sepsis: results from an updated and expanded systematic review and meta-analysis. Intensive Care Med. 46, 1552–1562. doi: 10.1007/s00134-020-06151-x - DOI - PMC - PubMed
    1. Fu J., Lan Q., Wang D., et al. (2018). Predictive value of red cell distribution width on the prognosis of patients with abdominal sepsis. Chin. Crit. Care Med. 30, 230–233. doi: 10.3760/cma.j.issn.2095-4352.2018.03.008 - DOI - PubMed
    1. Goldberger A. L., Amaral L. A., Glass L., et al. (2000). PhysioBank, PhysioToolkit, and PhysioNet: components of a new research resource for complex physiologic signals. Circulation 101, e215–e220. doi: 10.1161/01.CIR.101.23.e215 - DOI - PubMed
    1. Han Y., Duan J., Chen M., Huang S., Zhang B., Wang Y., et al. (2024). Relationship between serum sodium level and sepsis - induced coagulopathy. Front. Med. 10. doi: 10.3389/fmed.2023.1324369 - DOI - PMC - PubMed

LinkOut - more resources