. 2025 Jun 6:16:1602360.
doi: 10.3389/fpls.2025.1602360. eCollection 2025.

GWAS and RNA-seq reveal novel loci and genes of low-nitrogen tolerance in cucumber (Cucumis sativus L.)

Affiliations

GWAS and RNA-seq reveal novel loci and genes of low-nitrogen tolerance in cucumber (Cucumis sativus L.)

Huaxiang Wu et al. Front Plant Sci. .

Abstract

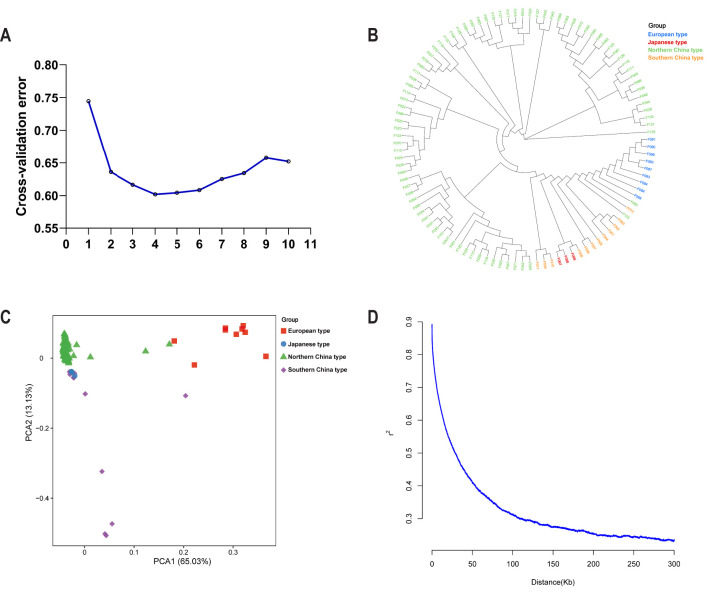
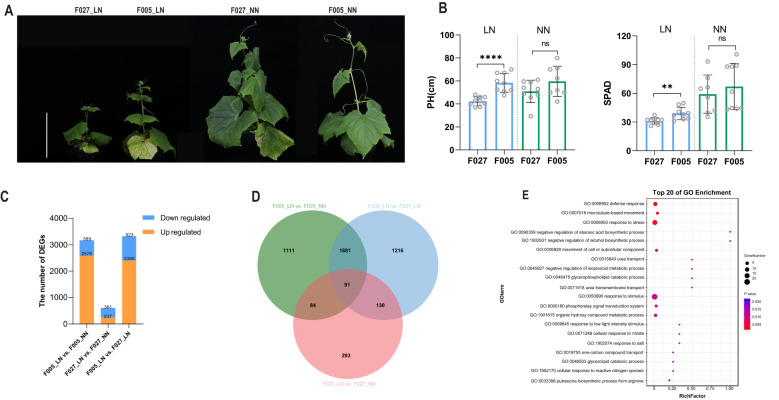
Cucumber (Cucumis sativus L.), a globally significant horticultural crop, requires substantial nitrogen inputs due to its high nutrient demand. However, the prevalent issues of low nitrogen use efficiency (NUE) in cultivars and excessive fertilizer application have led to increased production costs and environmental burdens. To identify quantitative trait nucleotides (QTNs) and genes associated with low-nitrogen tolerance, we conducted a genome-wide association study (GWAS) on a basis of three low-nitrogen tolerance traits and 594,066 single nucleotide polymorphisms (SNPs) of a natural population of 107 cucumber accessions. The transcriptome of low-nitrogen tolerant genotype (F005) and low-nitrogen sensitive genotype (F027) were sequenced between low and normal nitrogen treatments. Through GWAS, we identified 29 QTNs harboring 196 candidate genes, while RNA sequencing (RNA-seq) revealed 3,765 differentially expressed genes (DEGs). 24 were identified by both methods. Among these 24 genes, 20 genes showed significant phenotype differences among different haplotypes. These 20 genes were defined as more valuable candidate genes for low-nitrogen tolerance. Furthermore, functional validation of the candidate gene CsaV3_7G035390 (encoding a GATA9 transcription factor) was performed using virus-induced gene silencing (VIGS), which demonstrated that silencingn this gene significantly enhanced soil plant analysis development (SPAD) and leaf of nitrogen accumulation in cucumber, indicating its negative regulatory role in low-nitrogen tolerance. Collectively, this study provides novel genetic resources for improving NUE in cucumber breeding programs.

Keywords: CsGATA9; GWAS; RNA-Seq; VIGS; nitrogen use efficiency.


Conflict of interest statement

The authors declare that the research was conducted in the absence of any commercial or financial relationships that could be constructed as a potential conflict of interest.

Figures

Figure 1
Figure 1
Phenotypic analysis of PH, SPAD and SDW in response to LN. (A) PH, SPAD and SDW for 107 cucumber accessions under LN andNN. *** denote significance at P < 0.001, ** at P < 0.01, and * at P < 0.05. (B) Correlation analysis of PH, SPAD and SDW. The size of the circles represents the correlation coefficient, and the gradient color indicates the direction and strength of the correlation (positive or negative).
Figure 2
Figure 2
Population structure and LD decay analysis of the association panel consisting of 107 accessions. (A) Cross-validation error values for different numbers of clusters (K=1-10) based on genotype data. (B) Phylogenetic trees constructed based on maximum likelihood method. (C) PCA of the 107 accessions, with different colors representing different groups: Eurasian (red squares), Japanese (green circles), North Chinese (green triangles), and South Chinese (purple diamonds). (D) LD decay analysis of the 107 accessions.
Figure 3
Figure 3
Chromosomal distribution of main-effect QTNs associated with RN_PH, RN_SPAD and RN_SDW. The numbers on the left of a chromosome indicate the physical locations of the corresponding main-effect QTNs, measured in Mb. Main-effect QTNs associated with RN_PH are marked in green, RN_SPAD are marked in red, and RN_SDW are marked in brown. QTNs previously reported in published literature are marked in purple and underlined (Li et al, 2023a).
Figure 4
Figure 4
DGEs between two genotypes (F005, F027) under LN and NN. (A) Phenotypic presentation of F027 and F005 after nitrogen treatment. The scale bar represents 16 cm. (B) PH and SPAD for F027 and F005 after nitrogen treatment, with **** indicating significance at P < 0.0001, ** denote significance at P < 0.01, and “ns” indicating no significant difference. (C) Numbers of up- and downregulated DEGs under LN and NN conditions in F005 and F027. (D) Venn diagram analysis of line F005 and F027 under LN and NN. (E) GO analysis of 91 DEGs in (D), the size of the circles represents the number of genes, while the color gradient indicates the magnitude of the P value.
Figure 5
Figure 5
Candidate genes and functional validation of CsGATA9 by VIGS. (A) Heatmap showing the expression levels (FPKM) of candidate genes. The genes ID marked black across F005_LN vs. F005_NN, marked green across F027_LN vs. F027_NN, the overlap genes of two group marked orange. (B) Haplotype analysis of CasV3_7G035390 (CsGATA9), showing the expanded upstream 1 kb region and the distribution of different haplotypes (Hap. 1 and Hap. 2). (C) Boxplot showing the phenotypic performance of the two haplotypes of CsGATA9 in RN_SPAD and RN_PH. (***P<0.001 and “ns” indicating no significant difference). (D) Phenotypic differences among TRSV: CsPDS, TRSV: 00, and TRSV: CsGATA9 cucumber plants under low-nitrogen treatment for two weeks. TRSV: CsPDS plants, used as a positive control, exhibited typical chlorotic leaves, indicating the effectiveness of the TRSV system. TRSV: CsGATA9 plants showed reduced growth compared to TRSV:00 plants. (E) Relative expression levels of CsGATA9 in leaves of TRSV:00 and TRSV: CsGATA9 plants, measured by qPCR 14 days after viral inoculation. A significant reduction in CsGATA9 transcript levels confirms successful gene silencing (***P < 0.001). (F) Quantitative comparison of PH, SPAD and leaf of nitrogen content(%) between TRSV:00 and TRSV:CsGATA9 plant sunder LN. Plant height in TRSV:CsGATA9 plants was significantly reduced, while SPAD values and nitrogen content of leaf(%) were significantly increased compared to TRSV:00 plants (*P<0.05 and **P<0.01). Each bar represents the mean ± SD of three independent experiments, with three biological 867 replicates per experiment (n=3). Statistical significance was determined using Student’s t-test.

References

    1. Ahmad N., Su B., Ibrahim S., Kuang L., Tian Z., Wang X., et al. (2022). Deciphering the Genetic Basis of Root and Biomass Traits in Rapeseed (Brassica napus L.) through the Integration of GWAS and RNA-Seq under Nitrogen Stress. Int. J. Mol. Sci. 23, 7958. doi: 10.3390/ijms23147958 - DOI - PMC - PubMed
    1. Ahmed S. R., Asghar M. J., Hameed A., Ghaffar M., Shahid M. (2024). Advancing crop improvement through GWAS and beyond in mung bean. Front. Plant Sci. 15. doi: 10.3389/fpls.2024.1436532 - DOI - PMC - PubMed
    1. Alexander D. H., Novembre J., Lange K. (2009). Fast model-based estimation of ancestry in unrelated individuals. Genome Res. 19, 1655–1664. doi: 10.1101/gr.094052.109 - DOI - PMC - PubMed
    1. Cormier F., Faure S., Dubreuil P., Heumez E., Beauchêne K., Lafarge S., et al. (2013). A multi-environmental study of recent breeding progress on nitrogen use efficiency in wheat (Triticum aestivum L.). Theor. Appl. Genet. 126, 3035–3048. doi: 10.1007/s00122-013-2191-9 - DOI - PubMed
    1. Danecek P., Auton A., Abecasis G., Albers C. A., Banks E., DePristo M. A. (2011). The variant call format and VCFtools. Bioinf. (Oxford England) 27, 2156–2158. doi: 10.1093/bioinformatics/btr330 - DOI - PMC - PubMed

LinkOut - more resources