Review
. 2025 Jun 20;8(6):None.
doi: 10.1016/j.oneear.2025.101285.

Ten new insights in climate science 2024

Roberto Schaeffer  1 E Lisa F Schipper  2 Daniel Ospina  3 Paula Mirazo  4 Ane Alencar  5 Mehrnaz Anvari  6   7 Paulo Artaxo  8 Mehmet Efe Biresselioglu  9 Tanja Blome  10 Melanie Boeckmann  11 Ebba Brink  12 Wendy Broadgate  3 Mercedes Bustamante  13 Wenju Cai  14   15 Josep G Canadell  16 Roberto Cardinale  17 Maria Paz Chidichimo  18   19 Peter Ditlevsen  20 Ursula Eicker  21 Sarah Feron  22 Mahelet G Fikru  23 Sabine Fuss  24   25 Amadou T Gaye  26 Örjan Gustafsson  27 Niklas Harring  28 Cheng He  29 Sophie Hebden  3   30 Adrian Heilemann  7 Marina Hirota  31 Nandakumar Janardhanan  32 Sirkku Juhola  33 Tae Yong Jung  34 Jiang Kejun  35 Şiir Kilkiș  36 Nilushi Kumarasinghe  37   38 David Lapola  39 June-Yi Lee  40   41 Carolina Levis  31   42 Adelaide Lusambili  43 Joannes D Maasakkers  44 Claire MacIntosh  30 Jemilah Mahmood  45 Justin S Mankin  46   47 Pía Marchegiani  48   49 Maria Martin  7 Aditi Mukherji  50 Tischa A Muñoz-Erickson  4 Zeenat Niazi  51   52 Joseph Nyangon  53 Santosh Pandipati  54 Amarasinghage T D Perera  42 Geeta Persad  55 Åsa Persson  56   57 Aaron Redman  4   58 Ilona Riipinen  27 Johan Rockström  7   59 Sarah Roffe  60   61   62 Joyashree Roy  63 Boris Sakschewski  7 Bjørn H Samset  64 Peter Schlosser  4 Ayyoob Sharifi  65 Wan-Yu Shih  66 Giles B Sioen  67   68 Youba Sokona  69 Detlef Stammer  70 Sunhee Suk  68   71 Djiby Thiam  72 Vikki Thompson  73 Erin Tullos  55 René M van Westen  74 Ana Maria Vargas Falla  12 Daniel J Vecellio  75   76 John Worden  77 Henry C Wu  10 Chi Xu  78   79 Yang Yang  80 Mariam Zachariah  81 Zhen Zhang  82 Gina Ziervogel  72
Affiliations
Review

Ten new insights in climate science 2024

Roberto Schaeffer et al. One Earth. .

Abstract

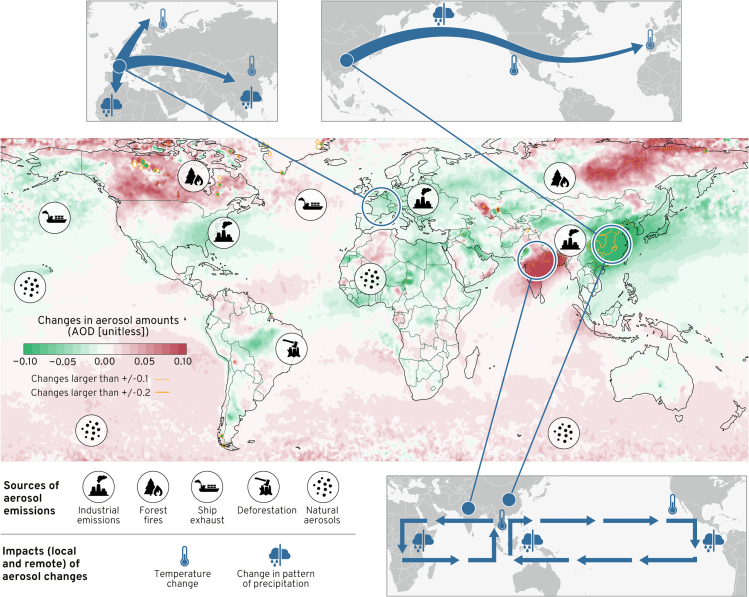
The years 2023 and 2024 were characterized by unprecedented warming across the globe, underscoring the urgency of climate action. Robust science advice for decision makers on subjects as complex as climate change requires deep cross- and interdisciplinary understanding. However, navigating the ever-expanding and diverse peer-reviewed literature on climate change is enormously challenging for individual researchers. We elicited expert input through an online questionnaire (188 respondents from 45 countries) and prioritized 10 key advances in climate-change research with high policy relevance. The insights span a wide range of areas, from changes in methane and aerosol emissions to the factors shaping citizens' acceptance of climate policies. This synthesis and communications effort forms the basis for a science-policy report distributed to party delegations ahead of the 29th session of the Conference of the Parties (COP29) to inform their positions and arguments on critical issues, including heat-adaptation planning, comprehensive mitigation strategies, and strengthened governance in energy-transition minerals value chains.

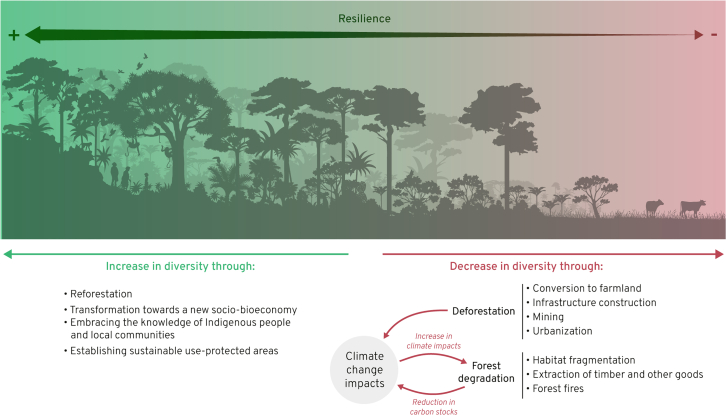
Keywords: adaptation; climate policy; climate science; governance; just transition; mitigation; resilience; science policy.


Conflict of interest statement

The authors declare no competing interests.

Figures

Figure 1
Figure 1
Annual methane emissions by source (average for the period 2010–2019) Estimate based on top-down integrative methods (top left) and bottom-up integrative methods (top right). Uncertainty ranges are indicated in square brackets. Data adapted from Saunois et al. Bottom: trends 1983–2024 in global atmospheric methane. Shaded area indicates decade over which emissions sources are attributed.
Figure 2
Figure 2
Recent changes in aerosols, related sources, and examples of remote effects Recent changes in aerosol amounts (difference between 2014–2023 and 2004–2013 period averages), quantified as aerosol optical depth (AOD) observations from MODIS Terra and Aqua. Main sources of aerosol emissions, responsible for the observed AOD changes (icons on map), and examples of remote impacts (local not show here for simplicity) of changes in aerosol loadings over Europe, East Asia, and South Asia are depicted in the top and bottom windows (including Walker circulation, at the bottom). Modified from Persad et al..
Figure 3
Figure 3
Increasing exposure to prolonged heat at different levels of global warming Implications of global warming for the proportion of the population exposed to heat. Map of present heat-humidity risks to humans with inset projections of the heat-humidity changes for West Africa as well as a plotted projection of the percentage of humanity exposed to unprecedented temperatures, both under different warming scenarios. Annual hot-hours global map (under 1.5°C warming) and West Africa and South Asia projections (under 1.5°C, 2°C, 3°C, and 4°C warming). Bottom left plot: projection of fraction of humanity exposed to unprecedented temperatures. Population (%) exposed to unprecedented heat (mean annual temperature  ≥29°C) for the different population distributions: 6.9 billion (green), 9.5 billion (blue), and 11.1 billion (gray).
Figure 4
Figure 4
Direct and indirect pathways of climate-change impacts on MRH Impacts are further amplified by socio-economic factors in a given setting. To strengthen preparedness and protect MRH in a changing climate, solutions must address existing challenges in climate adaptation plans, data, education, and gender and socio-economic norms and be driven by gender equity and reproductive justice.
Figure 5
Figure 5
Unprecedented SST, El Niño costs, and potential weakening of AMOC (A) The mean daily SST across the globe, collected from January 1979 to August 24, 2024 from ERA5. (B) Economic damages calculated as GDP change for the 3–5 years after noteworthy El Niño events with the center line indicating the mean of the projection and shading showing the 95% confidence intervals across regression bootstrap samples., Global GDP change is only calculated for countries with statistically significant marginal effects. (C) The historical AMOC strength based on a combination of annually averaged SST observations and reconstructions (red) shown with 11-year running means (black solid) indicating potential AMOC tipping scenario from 2021 to 2200 (gray dashed) with shading of interannual variability and uncertainty.
Figure 6
Figure 6
Amazon’s biological and cultural diversity enhance its resilience to climate change A high biodiversity landscape, both biological and biocultural, has higher resilience to climate-change impacts, compared to less diverse landscapes. Climate change and forest degradation are self-reinforcing feedbacks reducing the diversity of the Amazon system. Reforestation, a transformation toward a new socio-bioeconomy, embracing the knowledge of Indigenous people and local communities as well as protecting and establishing sustainable-use protected areas can increase diversity, effectively disrupting the self-reinforcing feedback loop.
Figure 7
Figure 7
SETS approach to urban heat Illustrated solutions to urban heat using a SETS approach compared to conventional approaches, to guide planning and integrate policies with co-benefits.
Figure 8
Figure 8
Addressing challenges of ETM value chain to achieve a just and equitable energy transition The ETM value chain and the challenges different stages present across environmental, social, economic, and technological domains.
Figure 9
Figure 9
Interaction factors leading to climate policy resistance or acceptance The interaction between political-economic contexts and policy designs can either lead to exclusion, injustice, and vulnerability—resulting in popular resistance—or to inclusion, fairness, and development—resulting in popular acceptance.

References

    1. WMO . World Meteorological Organization; 2025. WMO Confirms 2024 as Warmest Year on Record at about 1.55°C above Pre-industrial Level.https://wmo.int/news/media-centre/wmo-confirms-2024-warmest-year-record-...
    1. C3S (2025). Global Climate Highlights. Copernicus Climate Change Service - EU Observation Programme. https://climate.copernicus.eu/global-climate-highlights.
    1. NOAA-GML . National Oceanic & Atmospheric Administration; 2025. Trends in CO2, CH4, N2O, SF6. Global Monitoring Laboratory of the.https://gml.noaa.gov/ccgg/trends/
    1. WWA . World Weather Attribution; 2024. Analyses of Extreme Weather Events.https://www.worldweatherattribution.org/analyses/
    1. WMO . World Meteorological Organization; Geneva: 2024. State of the Global Climate 2023.<ext-link xmlns:xlink="http://www.w3.org/1999/xlink" ext-link-type="uri" xlink:href="https://library.wmo.int/idurl/4/68835">https://library.wmo.int/idurl/4/68835</ext-link>

LinkOut - more resources