. 2025 Jun 21;15(6):e71580.
doi: 10.1002/ece3.71580. eCollection 2025 Jun.

Present and Future of the White-Tailed Laurel Pigeon (Columba junoniae) on Gran Canaria Island

Affiliations

Present and Future of the White-Tailed Laurel Pigeon (Columba junoniae) on Gran Canaria Island

Gonzalo Albaladejo-Robles et al. Ecol Evol. .

Abstract

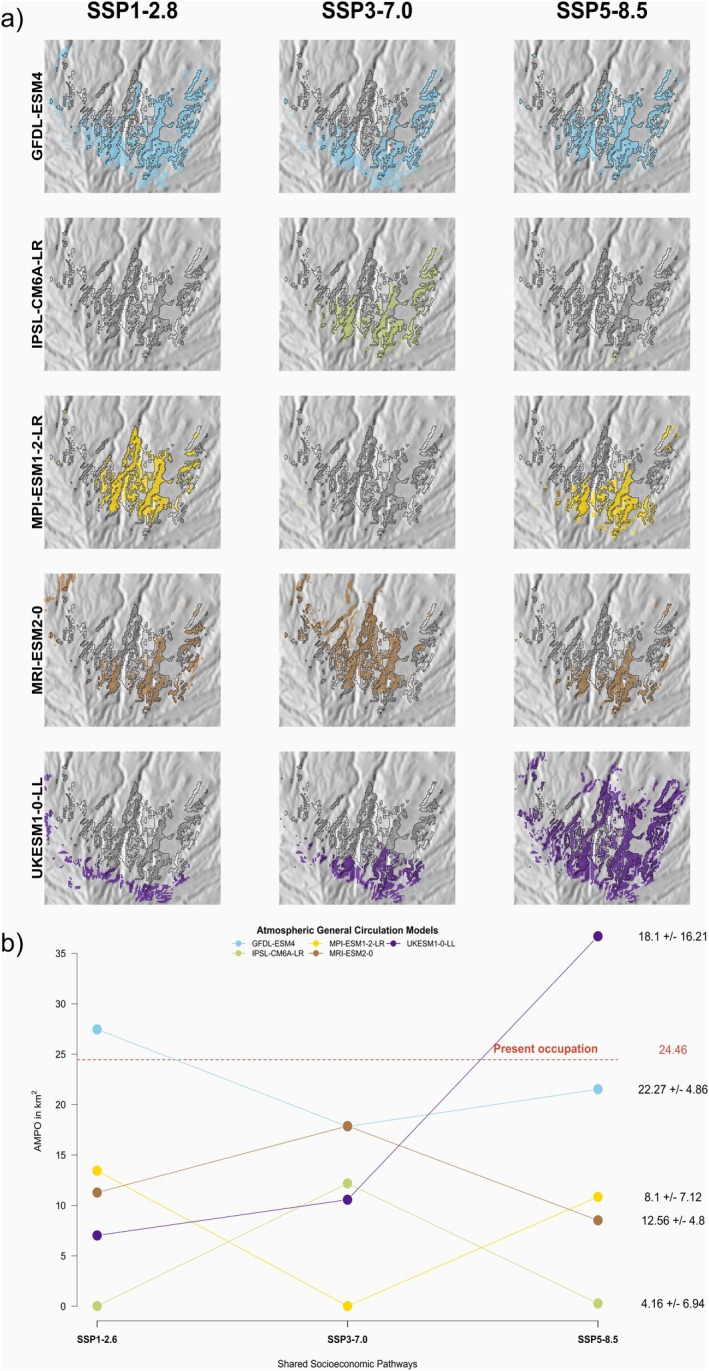
Due to their evolutionary history and restricted distribution islands species are particularly vulnerable to human impacts and extinction. Consequently, many islands' species have been extirpated, causing complete or local extinctions. Reintroductions are useful, although challenging, tools to restore ecosystems and halt biodiversity loss. In this work, we evaluate the reintroduction success of the endemic white-tailed laurel pigeon (Columba junoniae) on the island of Gran Canaria. We also explore its future potential distribution under different scenarios of climate change in the Canary Islands (Spain). We used a combination of Maximum Entropy models (MaxEnt), trained with spatial records within the whole range of the species, to model the potential distribution of C. junoniae on the island of Gran Canaria, where it was recently reintroduced. We compared this potential distribution with the actual distribution of the species in the reintroduction area. Furthermore, we used multiple scenarios of climate change to analyze the likely changes in the species' suitable habitat. We found that C. junoniae has colonized most of its potential habitat in the new reintroduction area. Overall, this marks that the reintroduction has successfully facilitated the spread and settlement of the species. However, our analysis also showed that this habitat is expected to suffer future fragmentations and contractions under different climate change scenarios. Based on our research, C. junoniae has colonised most of its potential habitat within its new distribution area. Although this is a huge milestone for the conservation of the species, future changes might jeopardise the species' future. In this scenario of accelerated environmental change, microhabitats and niche refuges can alleviate this situation. Our results also suggest that restoration of native forests is fundamental to ensure the species' long-term persistence and ecosystems' resilience against climate and land-use changes. This work sets the principles for the evaluation of the reintroduction of C. junoniae in Gran Canaria, as well as the long-term conservation strategy for the species in its new distribution area.

Keywords: birds; climate change; conservation; conservation evaluation; islands; management; reintroduction.


Conflict of interest statement

The authors declare no conflicts of interest.

Figures

FIGURE 1
FIGURE 1
Distribution of C. junoniae in the Canary Islands and Gran Canaria. (a) Dark polygons indicate the distribution of C. junoniae across the Canary Islands. (b) Blue dots represent all compiled observations from GBIF and Life+Rabiche, with red dots marking the subset used for the final analysis. (c) Detailed map of C. junoniae observations on Gran Canaria, highlighting data density. A numerical summary of records by island can be seen in Table S2. Shaded maps depict the topographic profiles of the islands, derived from a high‐resolution digital elevation model (DEM). Polygons and elevation data were sourced from the open repositories of the Instituto Geográfico Nacional (https://www.ign.es/).
FIGURE 2
FIGURE 2
Performance of MaxEnt models and contribution of environmental variables. (a) Model performance: Lines represent the performance of the 10 final selected models at different probability thresholds, evaluated using four accuracy metrics: AUC (area under the curve), PPP (proportion of positive predictions), and Type I & II errors. Dashed lines and points indicate the average values for each metric. (b) Environmental variable contributions: Bars show the average contribution of each variable to the models. Variables include bio_04 (temperature seasonality), bio_03 (isothermality), Tree (percentage of tree cover), terrain aspect and slope, Crop (percentage of crop cover), Grass (percentage of grassland cover), bio_15 (precipitation seasonality) and bio_14 (precipitation of the driest month). Precipitation seasonality and precipitation of the driest month are the most influential, explaining over 85% of model variance.
FIGURE 3
FIGURE 3
MaxEnt models used for the calculation of the present distribution of C. junoniae on the Island of Gran Canaria. The best 10 performing models out of 100 iterations of the SDM algorithm are presented (a–j) along with its average (k). Colour gradients represent the probability of occurrence for the species, from 0 (light blue) to 1 (dark yellow). Probability surfaces are presented on top of a topographical elevation model of Gran Canaria Island.
FIGURE 4
FIGURE 4
Prediction of the area of maximum probability of occupancy (AMPO) (red polygons) for the models regarding the historical distribution of C. junoniae (a–j). Details of the individual predictions for the 10 best models are presented in (panels a–j) along with the spatial combination of all Areas of Maximum Probability of Occurrence (AMPO) (k). The global AMPO (panel k) is the result of the combination of the individual models' AMPO spatial polygons. AMPO's are represented on top of a topographical elevation model of Gran Canaria Island.
FIGURE 5
FIGURE 5
Predicted future Area of Maximum Probability of Occupancy (AMPO) for C. junoniae on Gran Canaria under different climate scenarios. (a) Spatial distribution of future AMPO: Coloured polygons represent AMPO under three Shared Socioeconomic Pathways (SSPs, columns) and five atmospheric circulation models (rows). The current AMPO (dark grey area, from Figure 4k) is shown for comparison. Future AMPO areas are calculated as the combined predictions from the 10 best‐performing models. (b) Changes in AMPO size: The y‐axis shows the absolute change in AMPO under each SSP (x‐axis) for different atmospheric models (coloured lines and points). The average change in AMPO (mean ± standard deviation) is shown on the right, compared to the current AMPO (red dashed horizontal line).

Similar articles

References

    1. Armstrong, D. P. , McArthur N., Govella S., et al. 2013. “Using Radio‐Tracking Data to Predict Post‐Release Establishment in Reintroductions to Habitat Fragments.” Biological Conservation 168: 152–160. 10.1016/j.biocon.2013.09.028. - DOI
    1. Beck, J. , Böller M., Erhardt A., and Schwanghart W.. 2014. “Spatial Bias in the GBIF Database and Its Effect on Modeling Species' Geographic Distributions.” Ecological Informatics 19: 10–15.
    1. Benayas, J. M. R. , Newton A. C., Diaz A., and Bullock J. M.. 2009. “Enhancement of Biodiversity and Ecosystem Services by Ecological Restoration: A Meta‐Analysis.” Science 325, no. 5944: 1121–1124. - PubMed
    1. Booth, T. H. 2018. “Why Understanding the Pioneering and Continuing Contributions of BIOCLIM to Species Distribution Modelling Is Important.” Austral Ecology 43, no. 8: 852–860. 10.1111/aec.12628. - DOI
    1. Branton, M. , and Richardson J. S.. 2010. “Assessing the Value of the Umbrella‐Species Concept for Conservation Planning with Meta‐Analysis.” Conservation Biology 25, no. 1: 9–20. 10.1111/j.1523-1739.2010.01606.x. - DOI - PubMed

LinkOut - more resources