. 2025 May 21;28(6):112727.
doi: 10.1016/j.isci.2025.112727. eCollection 2025 Jun 20.

Post-transcriptional regulation of cyclin A and B mRNAs by Bruno 1, Cup, and P-bodies

Affiliations

Post-transcriptional regulation of cyclin A and B mRNAs by Bruno 1, Cup, and P-bodies

Livia V Bayer et al. iScience. .

Abstract

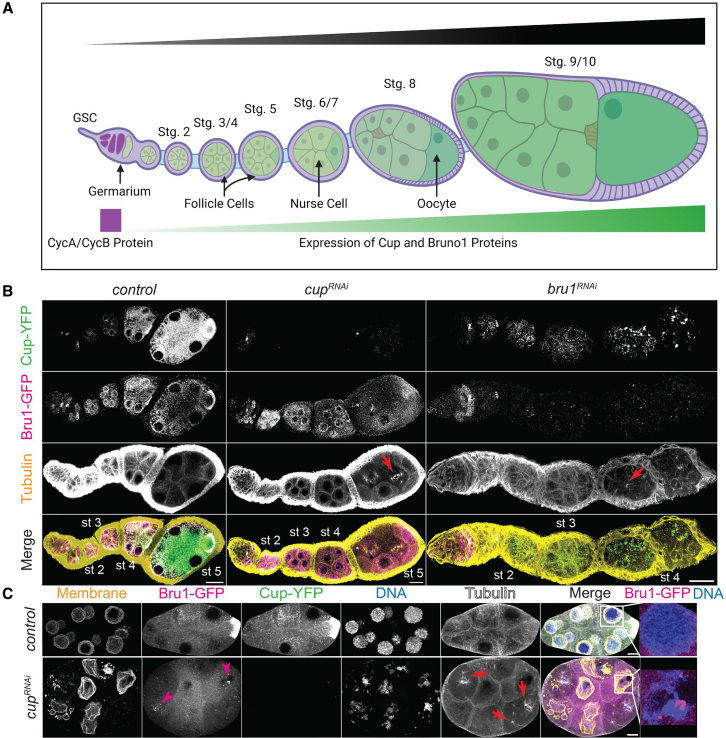
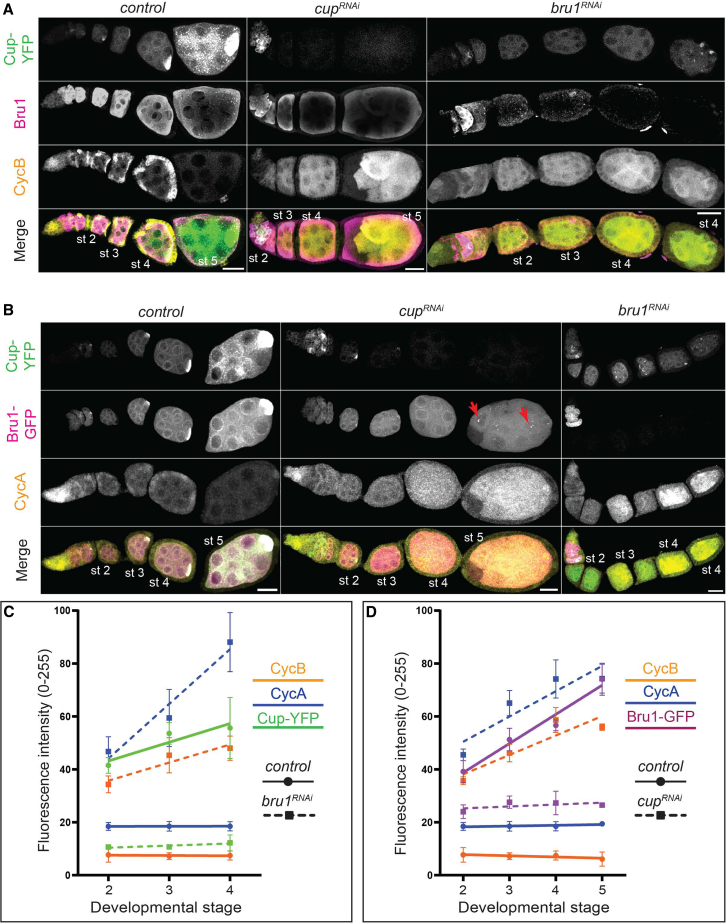
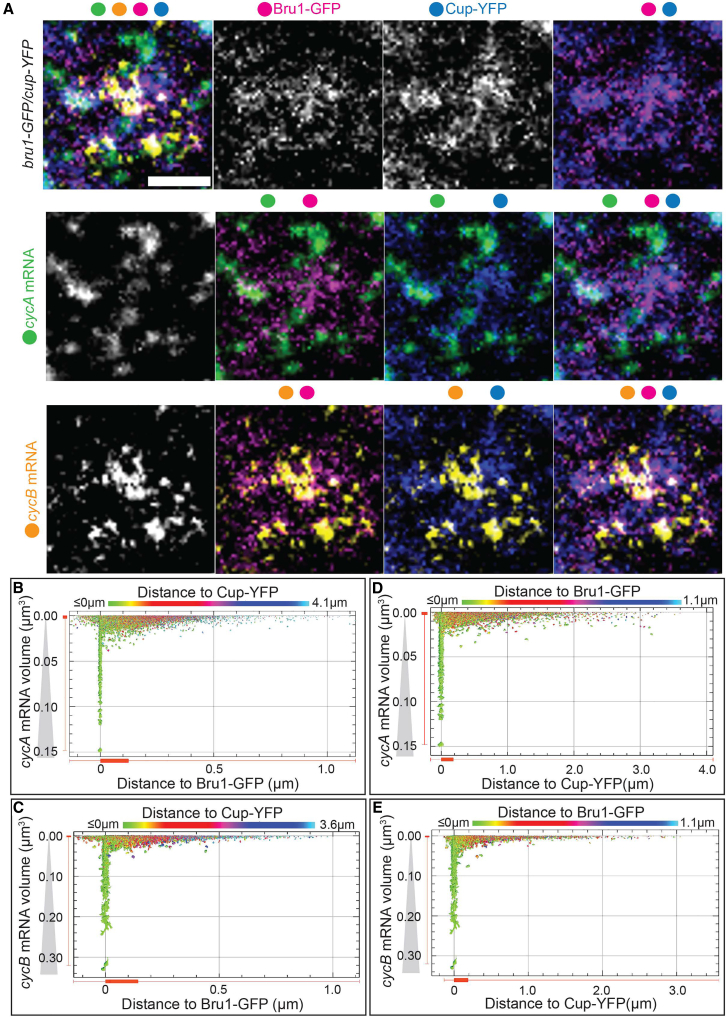
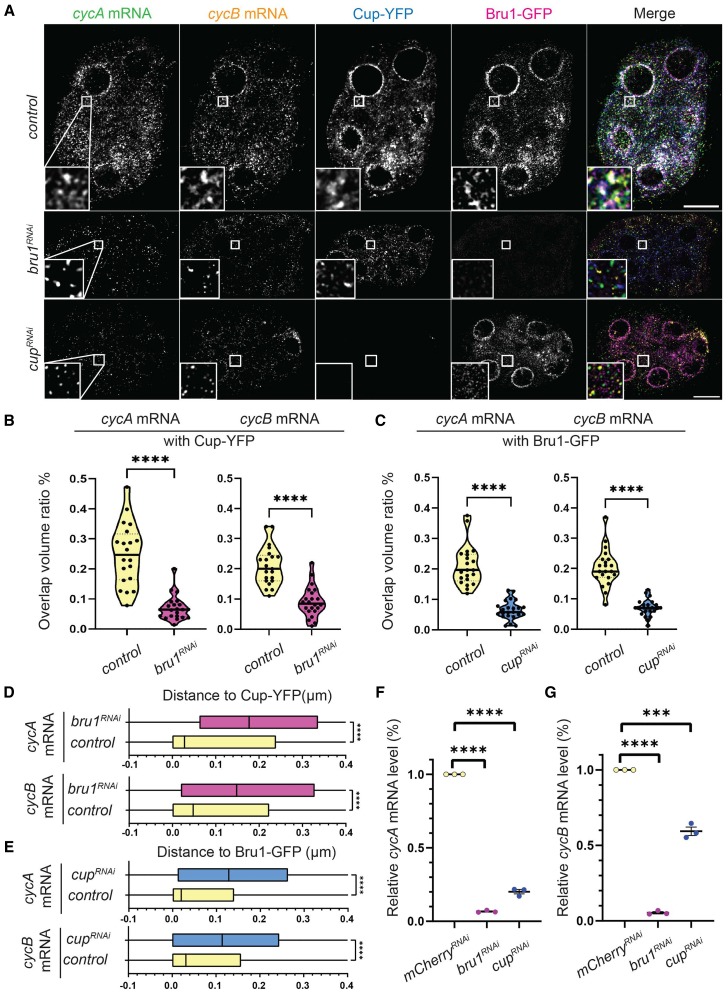
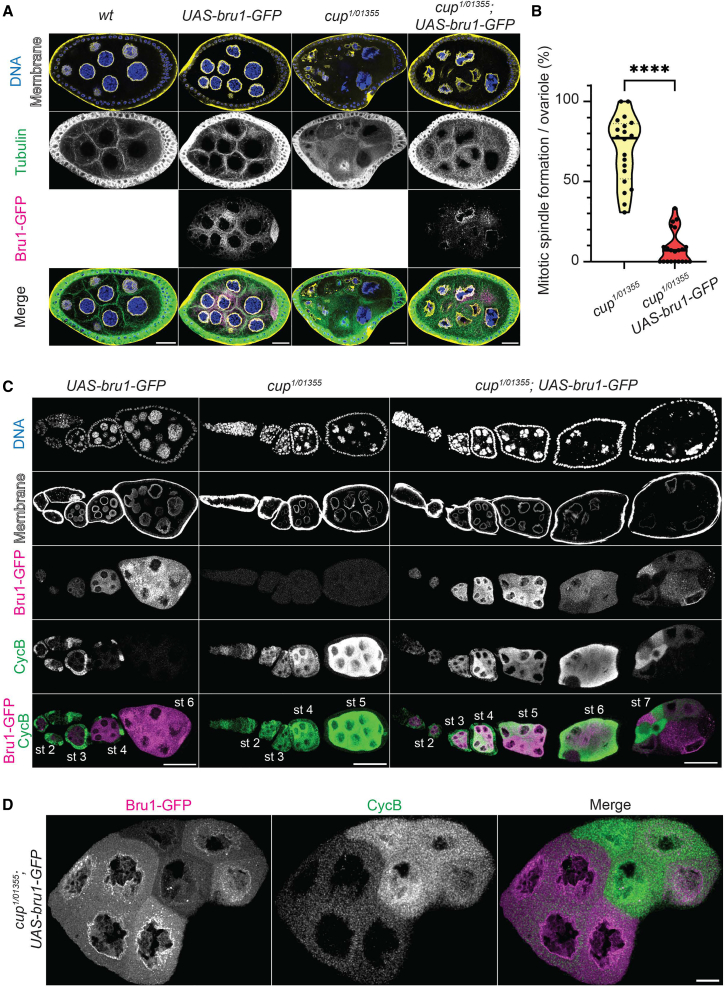
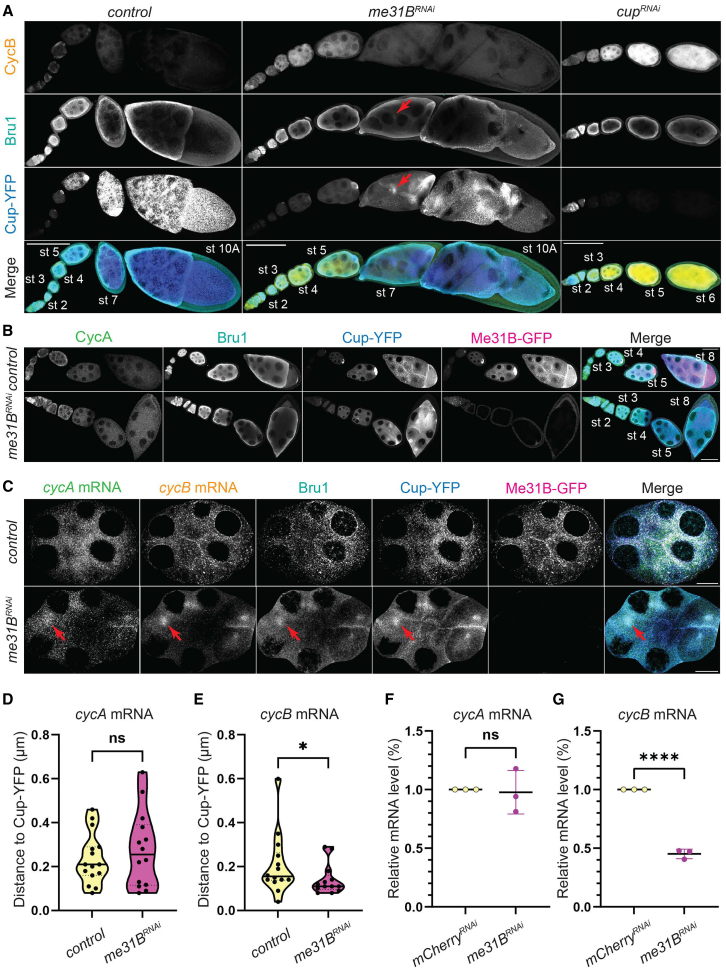
Cell cycle progression relies on tightly regulated Cyclin synthesis and degradation, with Cyclins A and B activating CDK1 to drive mitosis. Dysregulation of Cyclin levels is linked to tumorigenesis, underscoring the importance of studying cyclin mRNA control for cancer therapy development. Using super-resolution microscopy, we show that cyclin A and cyclin B mRNAs associate with Bruno 1 and Cup in nurse cells, and that depletion of either protein disrupts Cyclin expression and reduces mRNA levels. Both mRNAs also accumulate in Me31B-marked P-bodies; however, Me31B selectively affects cyclin B, causing its stage-specific de-repression and decreased stability, while cyclin A remains unaffected. Loss of Me31B enhances cyclin B mRNA's association with Cup, suggesting P-body-independent repression mechanisms. These results highlight the nuanced, mRNA-specific roles of P-body condensates in post-transcriptional regulation, challenging the idea of a uniform, binary mechanism of mRNA repression in P-bodies.

Keywords: Cell biology; Molecular interaction.


Conflict of interest statement

The authors declare no competing interests.

Figures

None
Graphical abstract
Figure 1
Figure 1
Bru1 and Cup knockdowns lead to re-entry of nurse cells into the cell cycle (A) A schematic model of the Drosophila melanogaster ovariole illustrating the developmental stages from the germarium to a stage 10 egg chamber, highlighting the expression patterns of CycA and CycB proteins, as well as the progressive increase of Cup and Bru1 proteins during oogenesis. Generated via BioRender. (B) Visualization of ɑ-Tubulin via IF in chains of egg chambers expressing Cup-YFP and Bru1-GFP in the indicated backgrounds. Formation of mitotic spindles in cupRNAi and bruRNAi backgrounds (red arrow). Images are deconvolved, XY max-intensity Z-projections of 5 optical slices (0.3 μm each). Scale bars, 20 μm. (C) Stage 6 egg chambers expressing Cup-YFP and Bru1-GFP in indicated backgrounds. Membrane (WGA stain). Nuclear aggregation of Bru1-GFP (magenta arrowheads and zoomed-in Merge panels). Formation of mitotic spindles (red arrows). Images are deconvolved, XY max-intensity Z-projections of 5 optical slices (0.3 μm each). Scale bars, 10 μm.
Figure 2
Figure 2
Bru1 and Cup knockdowns lead to the ectopic expression of CycA and CycB proteins (A) Visualization of CycB and Bru1 via IF in chains of egg chambers expressing Cup-YFP in the indicated backgrounds. Images are deconvolved, XY max-intensity Z-projections of 15 (control), 10 (cupRNAi) and 10 (bru1RNAi) optical slices (0.3 μm each). Scale bars, 20 μm. (B) Visualization of CycA via IF in chains of egg chambers expressing Cup-YFP and Bru1-GFP in the indicated backgrounds. Images are deconvolved, XY max-intensity Z-projections of 15 (control), 11 (cupRNAi) and 10 (bru1RNAi) optical slices (0.3 μm each). Scale bars, 20 μm. (C) Analysis of fluorescence intensity for CycB, CycA, and Cup-YFP protein expression in the germline cells of egg chambers in the specified developmental stages and backgrounds. Data are represented as mean ± SEM. (D) Analysis of fluorescence intensity for CycB, CycA, and Bru1-GFP protein expression in the germline cells of egg chambers in the specified developmental stages and backgrounds. Data are represented as mean ± SEM.
Figure 3
Figure 3
Bru1 and Cup form large complexes with cycA and cycB mRNAs in the nurse cell cytoplasm (A) Co-visualization via STED of cycA and cycB mRNAs in nurse cells of a sectioned egg chamber at mid-oogenesis expressing Bru1-GFP and Cup-YFP. Images are laid out as a ‘punnett square’ for depicting colocalization combinations of RNAs and proteins. Colored dots indicate the individual channels merged per image. Images are deconvolved, XY max-intensity Z-projections of 3 optical slices (0.1 μm each). Scale bar, 1 μm. (B–E) 2D-plots representing the distance to (μm - on the x axis) and the volume of (μm3-on the y axis) (B) Bru1-GFP and cycA mRNA, (C) Bru1-GFP and cycB mRNA, (D) Cup-YFP and cycA mRNA, and (E) Cup-YFP and cycB mRNA, respectively. The color spectrum of the heatmap indicates the distance to Cup-YFP (B, C) or to Bru1-GFP (D, E).
Figure 4
Figure 4
Bru1 and Cup are necessary for the formation of cycA and cycB mRNPs (A) Co-visualization of cycA and cycB mRNAs in stage 4 egg chambers expressing Bru1-GFP and Cup-YFP in the indicated backgrounds. White box indicates the location of the zoomed-in images. Images are deconvolved, XY max-intensity Z-projections of 5 optical slices (0.3 μm each). Scale bars, 10 μm. (B) Analysis of the ratio of overlap volume for cycA and cycB mRNAs with Cup-YFP performed in control and bru1RNAi egg chambers (stage 2–4). Violin plots represent each individual point, and the median (line) and quartiles (dash lines). Statistics were calculated using Mann-Whitney statistical tests. (∗∗∗∗p < 0.0001; control vs. bru1RNAi: n = 20 and n = 22). (C) Analysis of the ratio of overlap volume for cycA and cycB mRNAs with Bru1-GFP performed in control and cup1RNAi egg chambers (stage 2–4). Violin plots represent each individual point, and the median (line) and quartiles (dash lines). Statistics were calculated using Mann-Whitney statistical tests. (∗∗∗∗p < 0.0001; control vs. cup1RNAi: n = 21 and n = 23). (D) Shortest distance analysis of cycA and cycB mRNAs with Cup-YFP performed in control and bru1RNAi egg chambers (stage 2–4). Boxplots provide a zoomed-in representation of the 25th to 75th percentile particle localization, with the median indicated by a vertical line. Statistics were calculated using Mann-Whitney statistical tests. (∗∗∗∗p < 0.0001; control vs. bru1RNAi, cycA mRNA: n = 39105 and n = 53913, cycB mRNA: n = 54036 and n = 14529). (E) Shortest distance analysis of cycA and cycB mRNAs with Bru1-GFP performed in control and cup1RNAi egg chambers (stage 2–4). Boxplots provide a zoomed-in representation of the 25th to 75th percentile particle localization, with the median indicated by a vertical line. Statistics were calculated using Mann-Whitney statistical tests. (∗∗∗∗p < 0.0001; control vs. cup1RNAi, cycA mRNA: n = 39105 and n = 75524, cycB mRNA: n = 54036 and n = 76198). (F) RT-qPCR quantification of endogenous cycA mRNA normalized to rp49 mRNA. Statistical significance was determined by unpaired, two-tailed Student’s t test (mean ± SEM; ∗∗∗∗p < 0.0001; mCherryRNAin = 3, cupRNAin = 3). (G) RT-qPCR quantification of endogenous cycB mRNA normalized to rp49 mRNA. Statistical significance was determined by unpaired, two-tailed Student’s t test (mean ± SEM; ∗∗∗∗p < 0.0001; mCherryRNAin = 3, cupRNAin = 3).
Figure 5
Figure 5
Bru1 overexpression rescues mitotic re-entry of cup mutant egg chambers (A) Visualization of ɑ-Tubulin via IF in stage 6 egg chambers, where UAS-bru1-GFP transgene is expressed in the indicated backgrounds. Membrane (WGA stain). Images are deconvolved, XY max-intensity Z-projections of 3 (wt), 3 (UAS-bru1-GFP), 3 (cup1/01355) and 4 (cup1/01355; UAS-bru1-GFP) optical slices (0.3 μm each). Scale bars, 20 μm. (B) Analysis of mitotic spindle formation in cup1/01355 mutant egg chambers and in cup1/01355 mutant egg chambers expressing the UAS-Bru1-GFP transgene. Each data point represents the percentage of ovarioles containing at least one mitotic spindle formation event in cup1/01355 (n = 20) and cup1/01355; UAS-bru1-GFP (n = 21) ovaries. Statistics were calculated using Mann-Whitney statistical tests. (∗∗∗∗p < 0.0001). (C) Visualization of CycB via IF in chains of egg chambers, where UAS-bru1-GFP transgene is expressed in the indicated backgrounds. Membrane (WGA stain). Images are deconvolved, XY max-intensity Z-projections of 5 (UAS-bru1-GFP), 6 (cup1/01355) and 6 (cup1/01355; UAS-bru1-GFP) optical slices (0.3 μm each). Scale bars, 50 μm. (D) Visualization of CycB via IF in stage 7 egg chamber, where UAS-bru1-GFP transgene is expressed in cup1/01355 mutant background. Images are deconvolved, XY max-intensity Z-projections 4 optical slices (0.3 μm each). Scale bar, 10 μm.
Figure 6
Figure 6
cycA and cycB mRNAs accumulate in Me31B-bodies in a Bru1-and Cup-dependent manner (A) Co-visualization of cycA and cycB mRNAs with smFISH via STED in the nurse cell of a sectioned egg chamber at mid-oogenesis expressing Cup-YFP and Me31B-GFP. Colored dots indicate individual channels merged per image. Images are deconvolved, XY max-intensity Z-projections of 3 optical slices (0.1 μm each). Scale bar 1μm. (B) Co-visualization of cycA and cycB mRNAs via smFISH and Bru1 protein via IF in the nurse cell of a sectioned egg chamber at mid-oogenesis, expressing Cup-YFP and Me31B-GFP. Colored dots indicate the channels merged in the images. Images are deconvolved, XY max-intensity Z-projections of 5 optical slices (0.2 μm each). Scale bar 1 μm. (C) Co-visualization of cycA and cycB mRNAs via smFISH in the nurse cell of stage 5 egg chamber expressing Me31B-GFP in indicated RNAi backgrounds. Images are deconvolved, XY max-intensity Z-projections of 4 (control), 5 (bru1RNAi) and 5 (cupRNAi) optical slices (0.3 μm each). Scale bars, 1 μm. (D) Analysis of average shortest distance for cycA and cycB mRNAs with Me31B-GFP performed in control, bru1RNAi and cupRNAi egg chambers (stage 2–4). Violin plots represent each individual point, and the median (line) and quartiles (dash lines). Statistics were calculated using Mann-Whitney statistical tests. (cycA: ∗∗∗∗p < 0.0001, cycB: ∗∗∗p = 0.0001 (bru1RNAi), ∗∗∗p = 0.0006 (cupRNAi); control (n = 21), bru1RNAi (n = 20) and cupRNAi (n = 21)).
Figure 7
Figure 7
Me31B differentially regulates the translation of cycA and cycB mRNAs, but their association with Cup-YFP is independent of Me31B (A) Visualization of CycB and Bru1 via IF in chains of egg chambers expressing Cup-YFP in the indicated backgrounds. Accumulation of Bru1 and Cup (red arrows). Images are deconvolved, XY max-intensity Z-projections of 15 (control), 13 (me31BRNAi) and 16 (cupRNAi) optical slices (1 μm each). Scale bars, 100 μm. (B) Visualization of CycA and Bru1 via IF in chains of egg chambers expressing Cup-YFP and Me31B-GFP in the indicated backgrounds. Images are deconvolved, XY max-intensity Z-projections of 6 (control) and 6 (me31BRNAi) optical slices (1 μm each). Scale bars, 50 μm. (C) Co-visualization of cycA and cycB mRNAs and Bru1 protein via smFISH and IF in a sectioned mid-oogenesis egg chamber expressing Cup-YFP and Me31B-GFP in control and me31BRNAi backgrounds. Accumulation of cycA mRNA, cycB mRNA, Bru1 and Cup (red arrows). Images are deconvolved, XY max-intensity Z-projections of 5 (control) and 9 (me31BRNAi) optical slices (0.2 μm each). Scale bars, 10 μm. (D) Shortest distance analysis of cycA mRNA to Cup-YFP was performed in control and me31BRNAi backgrounds in stages 6–8 egg chambers. Violin plots represent each individual point, and the median (line) and quartiles (dash lines). Statistics were calculated using Mann-Whitney statistical tests. (NS; control n = 15, me31BRNAin = 14). (E) Shortest distance analysis of cycB mRNA to Cup-YFP was performed in control and me31BRNAi backgrounds in stages 6–8 egg chambers. Violin plots represent each individual point, and the median (line) and quartiles (dash lines). Statistics were calculated using Mann-Whitney statistical tests. (∗p = 0.049; control n = 14, me31BRNAin = 13). (F) RT-qPCR quantification of endogenous cycA mRNA normalized to rp49 mRNA. Statistical significance was determined by unpaired, two-tailed Student’s t test (mean ± SEM; NS; mCherryRNAin = 3, me31BRNAin = 3). (G) RT-qPCR quantification of endogenous cycB mRNA normalized to rp49 mRNA. Statistical significance was determined by unpaired, two-tailed Student’s t test (mean ± SEM; ∗∗∗∗p < 0.0001; mCherryRNAin = 3, me31BRNAin = 3).

Update of

Similar articles

Cited by

References

    1. Pluta A.J., Studniarek C., Murphy S., Norbury C.J. Cyclin-dependent kinases: Masters of the eukaryotic universe. Wiley Interdiscip. Rev. RNA. 2023;15 doi: 10.1002/wrna.1816. - DOI - PMC - PubMed
    1. Malumbres M., Barbacid M. Cell cycle, CDKs and cancer: a changing paradigm. Nat. Rev. Cancer. 2009;9:153–166. doi: 10.1038/nrc2602. - DOI - PubMed
    1. Ye C., Wang J., Wu P., Li X., Chai Y. Prognostic role of cyclin B1 in solid tumors: a meta-analysis. Oncotarget. 2017;8:2224–2232. doi: 10.18632/oncotarget.13653. - DOI - PMC - PubMed
    1. Dalby B., Glover D.M. 3’ non-translated sequences in Drosophilacyclin B transcripts direct posterior pole accumulation late in oogenesis and peri-nuclear association in syncytial embryos. Development. 1992;115:989–997. doi: 10.1242/dev.115.4.989. - DOI - PubMed
    1. Reed B.H., Orr-Weaver T.L. The Drosophila gene morula inhibits mitotic functions in the endo cell cycle and the mitotic cell cycle. Development. 1997;124:3543–3553. doi: 10.1242/dev.124.18.3543. - DOI - PubMed

LinkOut - more resources