. 2025;2(1):24.
doi: 10.1038/s44323-025-00039-z. Epub 2025 Jun 18.

The complexity and commonness of the two-process model of sleep regulation from a mathematical perspective

Affiliations

The complexity and commonness of the two-process model of sleep regulation from a mathematical perspective

Anne C Skeldon et al. NPJ Biol Timing Sleep. 2025.

Abstract

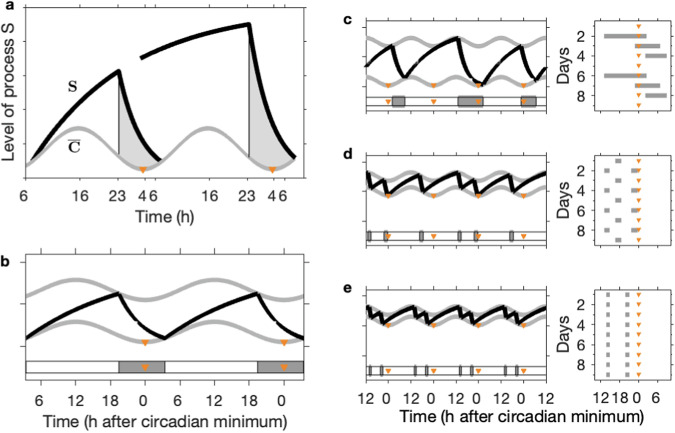
The two-process model (2pm) of sleep regulation is a conceptual framework and consists of mathematical equations. It shares similarities with models for cardiac, respiratory and neuronal rhythms and falls within the wider class of coupled oscillator models. The 2pm is related to neuronal mutual inhibition models of sleep-wake regulation. The mathematical structure of the 2pm, in which the sleep-wake cycle is entrained to the circadian pacemaker, explains sleep patterns in the absence of 24 h time cues, in different species and in early childhood. Extending the 2pm with a process describing the response of the circadian pacemaker to light creates a hierarchical entrainment system with feedback which permits quantitative modelling of the effect of self-selected light on sleep and circadian timing. The extended 2pm provides new interpretations of sleep phenotypes and provides quantitative predictions of effects of sleep and light interventions to support sleep and circadian alignment in individuals, including those with neurodegenerative disorders.

Keywords: Circadian mechanisms; Circadian regulation; Circadian rhythms and sleep; Sleep; Sleep deprivation; Slow-wave sleep.


Conflict of interest statement

Competing interestsA.C.S. has no competing interests. D.J.D. is a consultant to Boehringer Ingelheim and Astronautx, and collaborates and/or has received equipment from SomnoMed and VitalThings.

Figures

Fig. 1
Fig. 1. The two process model.
a The two processes in the two-process model (2pm) as depicted in Fig. 4 from. S represents the homeostatic sleep pressure, C¯ is the circadian drive for wakefulness. The grey shaded region highlights times when sleep occurs. b The 2pm including upper and lower thresholds, as described in. Homeostatic sleep pressure (black line) increases during wake and decreases during sleep. Switching between wake and sleep and sleep and wake occurs at upper and lower thresholds respectively (grey lines). The thresholds are modulated according to a circadian rhythm. Here the circadian rhythm is assumed to be entrained to 24 hours. The timing of sleep is shown by the horizontal grey bars with the orange triangles indicating the times of the circadian minimum. Parameter values: χs = 4.2 h, χw = 18.2 h, H0+= 0.67, H0= 0.17, a = 0.12, μ = 1. c–e Simulations for different values of the mean lower threshold and χs = 4.2 h, χw = 18.2 h, H0+= 0.75, a = 0.07, μ = 1. In each pair of panels the lefthand panel shows the 2pm and the righthand panel shows a raster plot indicating the timing of sleep relative to the circadian minima (orange triangles). c Shows a repeating rhythm consisting of three sleep periods every four days, H0= 0.09. d Shows a repeating rhythm consisting of three sleep periods every two days, H0= 0.50. e Shows a polyphasic sleep pattern consisting of two sleep periods every day, H0= 0.58.
Fig. 2
Fig. 2. Threshold models.
Four different threshold models for physiological processes acting on different timescales including neuronal, cardiac,, breathing and sleep-wake regulation. Each model can be represented either as a timeseries, as in the upper panels, or a circle map, as illustrated in the lower panels. The circle map description is constructed by using the fact that each threshold model is essentially a rule that describes how one time of hitting the upper threshold maps to the next time of hitting the upper thresholds. Since in all models, the threshold is periodic with (scaled) period 1, this rule can be considered as a rule that takes one value in the interval [0, 1) and maps it to another value in the interval [0, 1). Further detail on the circle map construction is given in Supplementary Fig. S1.
Fig. 3
Fig. 3. A neuronal mutual inhibition model and its relation to the two-process model.
a Neuronal structure underpinning sleep-wake regulation, based on the conceptual framework of Saper, Scammell & Lu as framed by Phillips & Robinson. (In this model the impact of the suprachiasmatic nucleus (SCN) is primarily by variation of inhibition of the sleep drive. Based on physiology, it is more likely that the SCN primarily activates the wake promoting part of the system during most of the 24 h day, with only small contributions to sleep drive late in the biological night). be Simulation of the Phillips-Robinson model for standard parameter values. b Homeostatic sleep pressure increases during wake and decreases during sleep. c Sinusoidal representation of the circadian rhythm from the SCN entrained to 24 h. d Firing rate of wake active neurons (high during wake and low during sleep). e Firing rate of sleep active neurons (high during sleep and low during wake). f Hysteretic representation of the Phillips-Robinson model. In this representation, there is a folded surface which results from the mutual inhibition of the wake active and sleep active neuronal populations. The time dependent sleep drive results in a trajectory (blue/red) that evolves over the surface, switching between the wake (upper) surface to the sleep (lower) surface at the folds (tipping points) which are indicated by the black circles on the black line. g The Phillips-Robinson model in the form of the two-process model. The homeostatic sleep pressure (blue/red curve) increases during wake and decreases during sleep and is colour-coded as in panel f. The mean level of the upper (lower) threshold is given by the value of the drive at the upper (lower) fold in panel f. The oscillation of the thresholds is given by the circadian inhibitory input to the sleep drive. The hysteretic structure suggests that it is the upper threshold that is of prime relevance during wake, and the lower threshold which is of prime relevance during sleep, we have therefore drawn the relevant `active' threshold in dark grey and the 'inactive' threshold in light grey.
Fig. 4
Fig. 4. Wake effort.
In the neuronal interpretation of the two-process model, during wake, once the upper threshold has been reached to remain awake requires effort i.e. additional input to wake active neurons which shifts the position of the upper threshold. During sleep, if awoken while homeostatic sleep pressure is above the upper threshold, then again effort is required to shift the upper threshold (grey dashed lines). Regions in which wake effort is needed are highlighted in magenta. As in Fig. 3 we have drawn the `active' parts of the thresholds in dark grey and the `inactive' parts of the thresholds in light grey.
Fig. 5
Fig. 5. Increasing drive to sleep active neurons decreases the mean levels of the thresholds.
Simulation of the Phillips-Robinson model for different values of the drive to sleep active neurons. The gap between the thresholds in the 2pm model do not change, but lowering the thresholds increases sleep duration because of the exponential nature of the model for homeostatic sleep pressure. As in Fig. 3 we have drawn the `active' parts of the thresholds in dark grey and the `inactive' parts of the thresholds in light grey.
Fig. 6
Fig. 6. Natural period of the sleep-wake oscillator.
a The two-process model (2pm) with the circadian amplitude set to zero. For the standard parameters (χs = 4.2 h, χw = 18.2 h, H0+= 0.67, H0= 0.17, μ = 1) the period of the sleep-wake cycle is approximately 22.6 h, of which approximately 5.8 h is sleep ( ~ 26%). The righthand panel shows a raster plot with the timing of sleep on successive 24 h days. b–h Illustration of the dependence of the natural period on the parameters in the 2pm, as given by equations (1)-(3). The vertical red line indicates the position of the standard parameters. Since it is sometimes useful to describe the position of the thresholds by a mean value and the separation instead of an upper and lower value, we have shown the dependence of sleep and wake duration on the value of the upper threshold H0+, the value of the lower threshold H0 and also the mean level of the thresholds (H0++H0)/2 and the separation of the thresholds H0+H0.
Fig. 7
Fig. 7. Entrainment of the sleep-wake oscillator by the circadian oscillator: Arnold tongues.
a Number of sleeps per day as a function of the mean level of the upper threshold, H0+ (upper horizontal axis) and corresponding natural period of the sleep-wake oscillator (lower horizontal axis) and the circadian amplitude, generated by simulating the 2pm for approximately 110,000 different parameter values. The remaining parameters are: χs = 4.2 h, χw = 18.2 h, H0= 0.17, μ = 1. Regions are shaded according to the number of sleeps per day. The black lines are contour lines. Both the shading and the contours are on a logarithmic scale (base 2). The largest region corresponds to monophasic sleep. In principle there are regions of n sleeps per day for m circadian periods for every integer pair (n, m) for every n/m. In practice, the upper and lower limits of the values for n/m are bounded by the choices of the other parameters. For the example shown 0.068 < n/m < 2.54 days. Each region forms a tongue with the tip of the tongue occurring at zero circadian amplitude for the value of H0+ which gives a natural period of m/n. b–g Examples of simulations for different values of H0+ at a fixed circadian amplitude of a = 0.08, i.e. taking a horizontal line across panel a. In each case the two-process model along with a raster plot is shown. The orange triangles mark the time of the circadian minimum. b Polyphasic sleep pattern. c Two sleeps a day. d Monophasic sleep with the circadian minimum occurring near the end of the night. e Monophasic sleep with the circadian minimum occurring near the beginning of the night. f Four sleeps every five days. g One sleep every two days.
Fig. 8
Fig. 8. Devil’s staircase.
As the natural period is increased for fixed circadian amplitude the number of sleeps per day follows a pattern known as a `Devil’s staircase'. Here this is illustrated for the fixed parameter values χs = 4.2 h, χw = 18.2 h, H0= 0.17, μ = 1 and a = 0.12 by varying the value of the upper threshold H0+ i.e. taking a horizontal line across Fig. 7a. Note the curvature of the tongues means that the plateau at, for example, Tnat = 1/3 corresponds to 2 sleeps a day. b–f Example raster plots for different values of H0+.
Fig. 9
Fig. 9. The homeostatic-circadian-light (HCL) model.
Adapted from ref. . In the HCL model, light, gated by sleep, is fed into a model which captures the phase and dose response of light on the circadian pacemaker. The circadian pacemaker then results in a wake propensity rhythm which, when combined with sleep homeostasis, results in patterns of sleep and wake.

Similar articles

Cited by

References

    1. Borbély, A. A. A two process model of sleep regulation. Hum. Neurobiol.1, 195–204 (1982). - PubMed
    1. Daan, S., Beersma, D. G. M. & Borbély, A. A. Timing of human sleep: Recovery process gated by a circadian pacemaker. Am. J. Physiol.246, R161–R183 (1984). - PubMed
    1. Dijk, D.-J. & Czeisler, C. A. Contribution of the circadian pacemaker and the sleep homeostat to sleep propensity, sleep structure, electroencephalographic slow waves, and sleep spindle activity in humans. J. Neurosci.15, 3526–3538 (1995). - PMC - PubMed
    1. Dijk, D.-J., Duffy, J. F., Riel, E., Shanahan, T. L. & Czeisler, C. A. Ageing and the circadian and homeostatic regulation of human sleep during forced desynchrony of rest, melatonin and temperature rhythms. J. Physiol.516, 611–627 (1999). - PMC - PubMed
    1. Borbély, A. A. & Wirz-Justice, A. Sleep, sleep deprivation and depression. a hypothesis derived from a model of sleep regulation. Hum. Neurobiol.1, 205–210 (1982). - PubMed

LinkOut - more resources