. 2025 Jun 6:16:1606125.
doi: 10.3389/fimmu.2025.1606125. eCollection 2025.

Unraveling the role of GPCR signaling in metabolic reprogramming and immune microenvironment of lung adenocarcinoma: a multi-omics study with experimental validation

Affiliations

Unraveling the role of GPCR signaling in metabolic reprogramming and immune microenvironment of lung adenocarcinoma: a multi-omics study with experimental validation

Zhaoxuan Wang et al. Front Immunol. .

Abstract

Background: Lung adenocarcinoma (LUAD) is characterized by metabolic and immune heterogeneity, driving tumor progression and therapy resistance. While G protein-coupled receptors (GPCR) signaling is known to regulate metabolism and immunity in cancers, its role in LUAD remains poorly defined. This study explores the influence of GPCR signaling on LUAD metabolism and immune landscape.

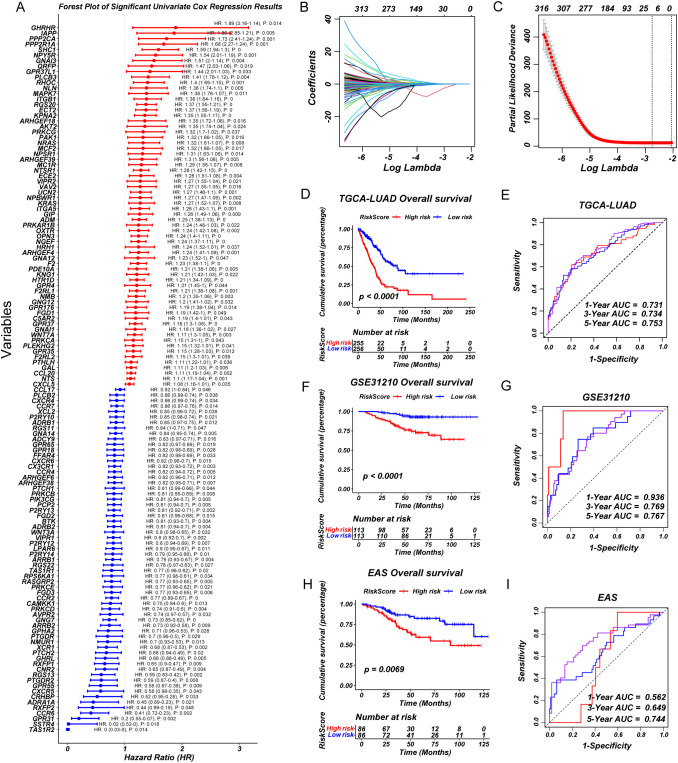
Methods: We performed non-negative matrix factorization (NMF) clustering of GPCR signaling genes in TCGA-LUAD cohort to identify distinct molecular subgroups. A prognostic model was developed based on GPCR signaling genes using least absolute shrinkage and selection operator (LASSO) analysis and Cox regression. Differentially expressed genes were analyzed for metabolic pathway enrichment and immune infiltration. In addition, key genes within GPCR signaling were identified and validated through functional assays.

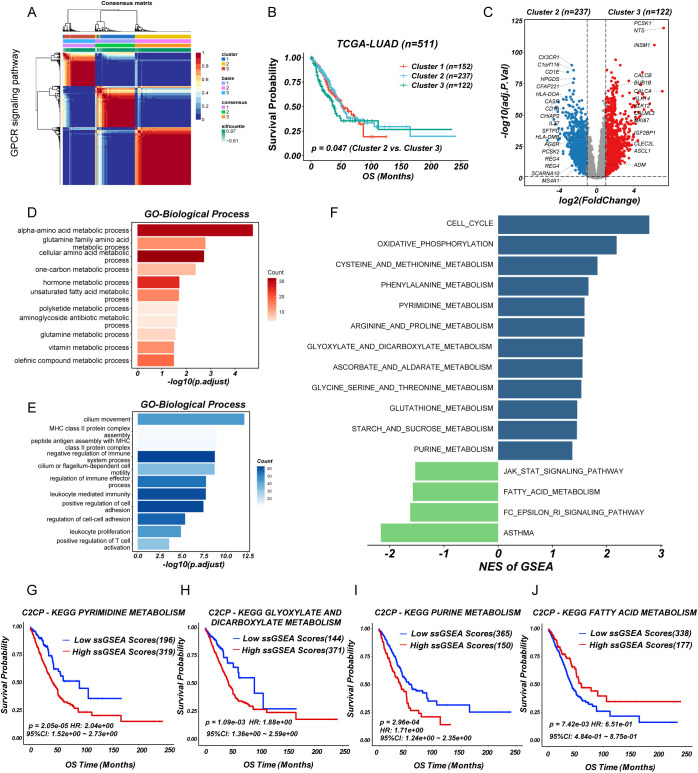
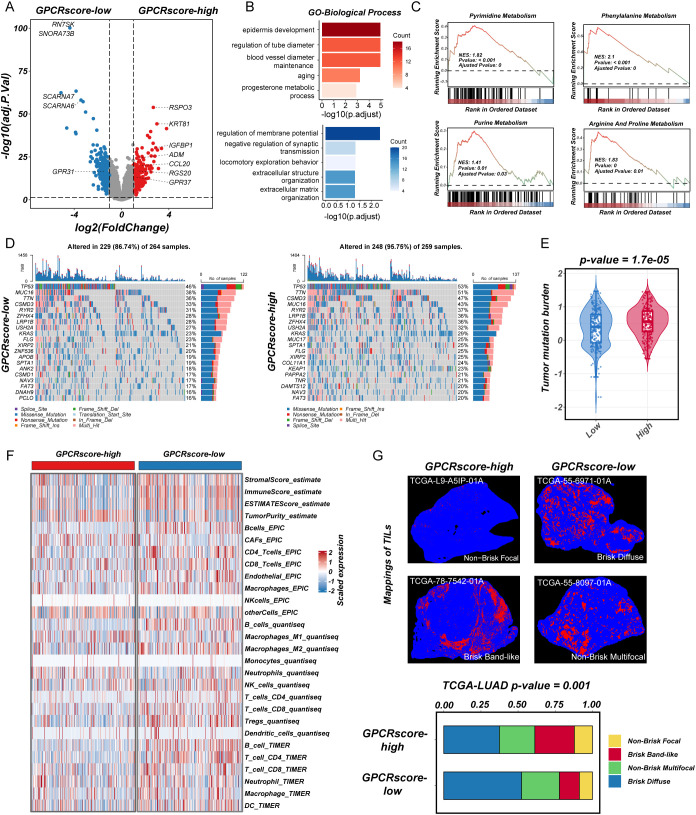
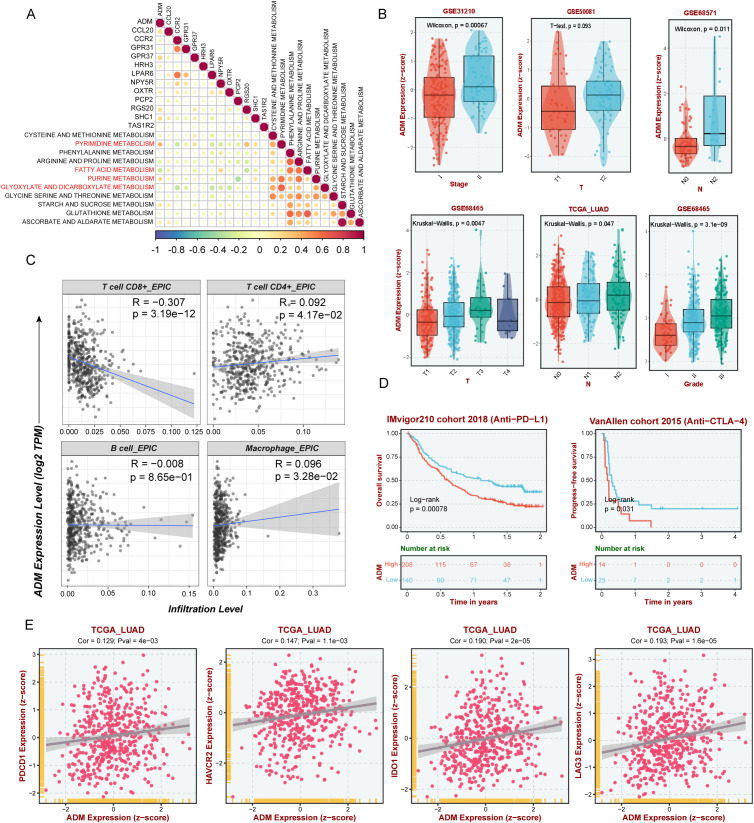
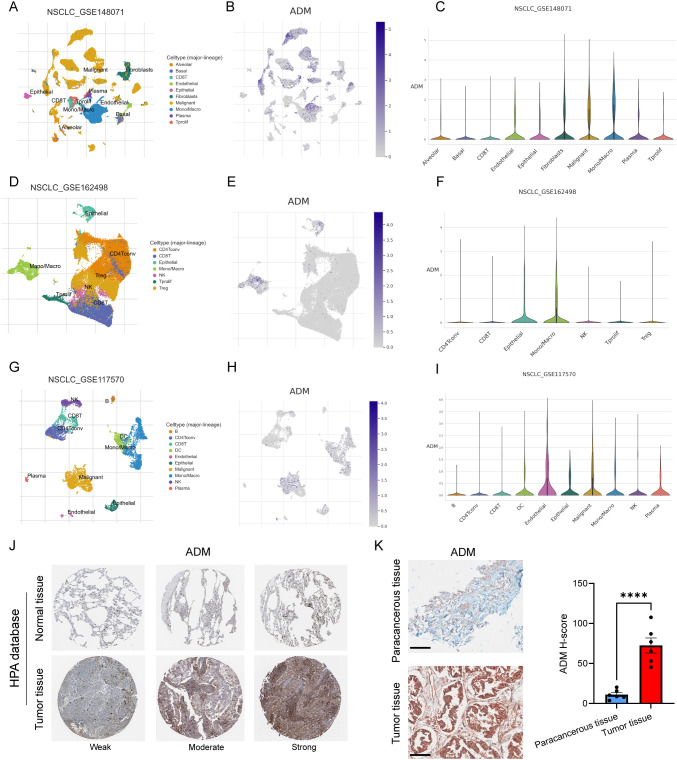
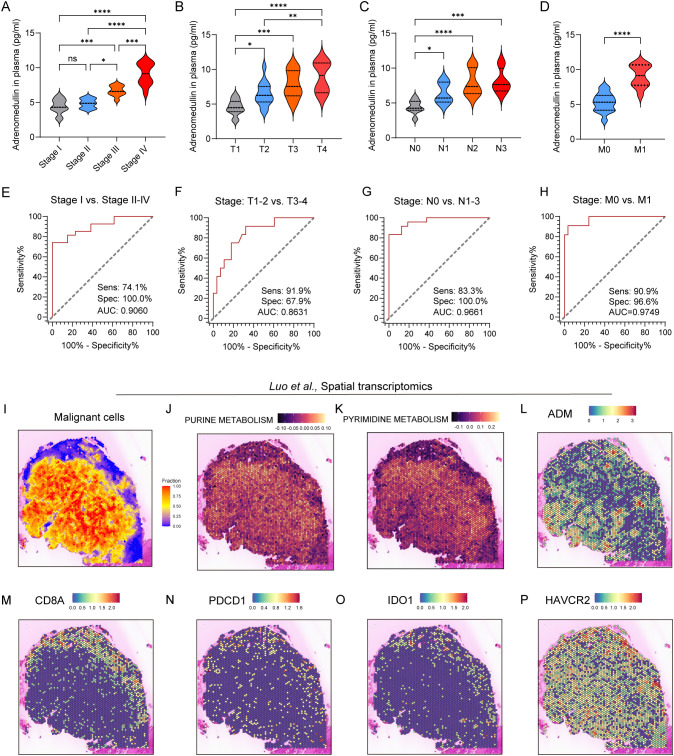
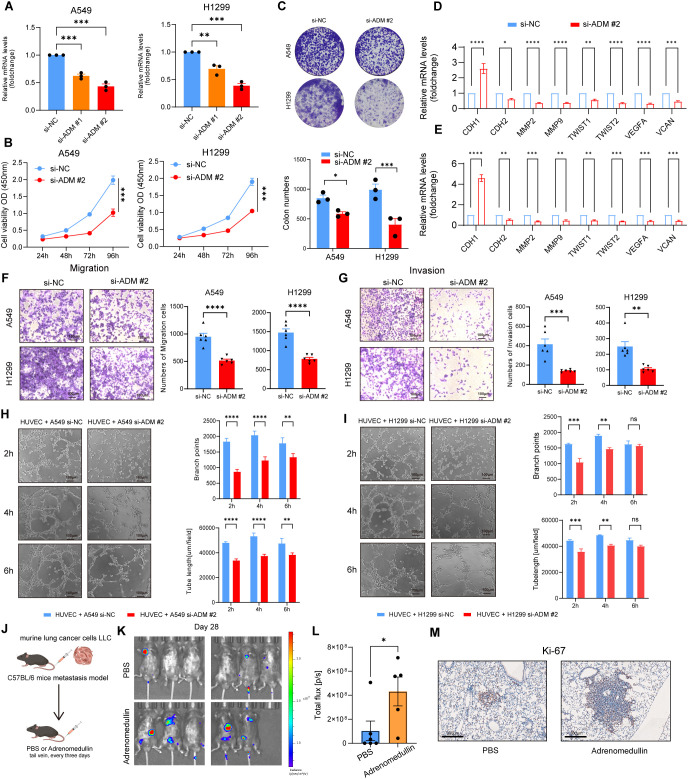
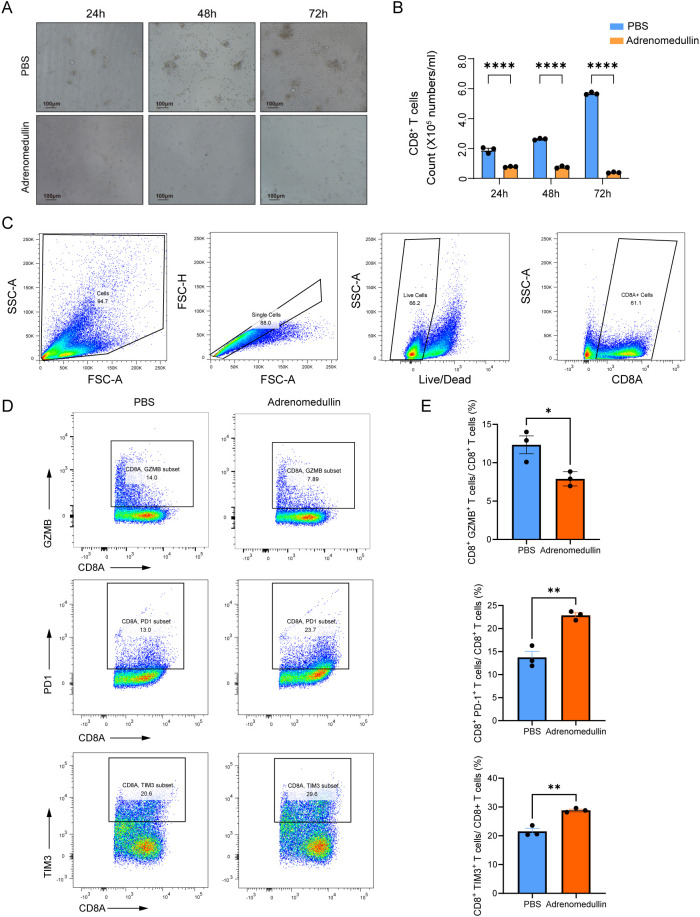
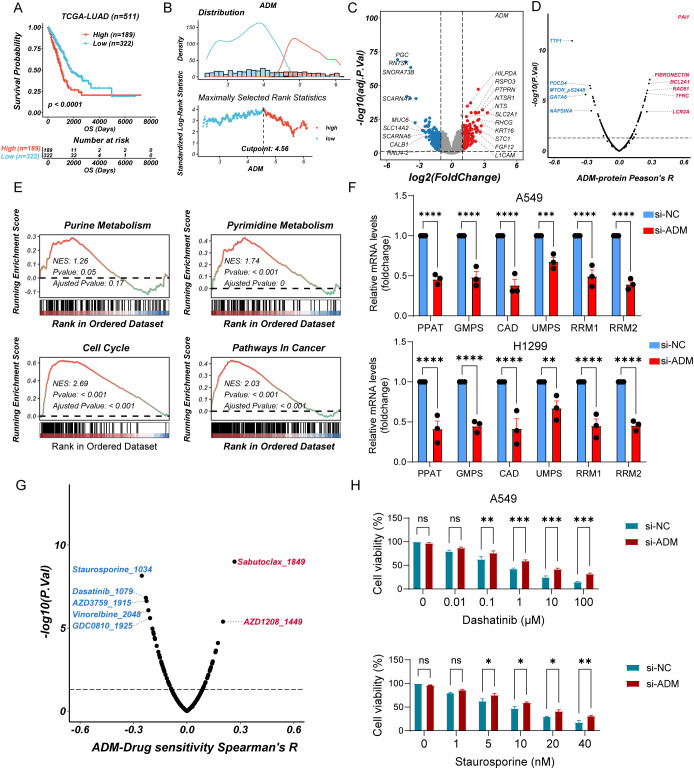
Results: NMF clustering based on GPCR signaling identified three subgroups in LUAD, with cluster 3 exhibiting poorer overall survival and significant enrichment in multiple prognostic associated metabolism pathways including purine, pyrimidine, glyoxylate and dicarboxylate metabolism. Then, we developed a GPCRscore prognostic model and validated across multiple cohorts, which effectively stratified LUAD patients into distinct risk groups. High-risk LUAD patients had an immunosuppressive microenvironment and activated metabolic reprogramming. ADM was identified as a key gene in the high-risk group, correlating with tumor stage, immune suppression, and resistance to immunotherapy. Clinically, ADM was highly expressed in tumor tissues and shows elevated concentrations in the peripheral blood of patients with advanced-stage LUAD. Subsequently, we demonstrated that knock-down of ADM in LUAD cells impaired their proliferation, migration, and invasion, while also reducing the angiogenic potential of endothelial cells in vitro. Adrenomedullin promoted LUAD progression in a murine metastasis model. Further, adrenomedullin inhibited CD8+ T cells proliferation, induced exhaustion, and impaired cytotoxic function. Finally, drug sensitivity and cell viability analysis showed LUAD patients with high levels of ADM exhibited sensitivity to the treatment of Staurosporine and Dasatinib.

Conclusions: In summary, this study reveals the pivotal role of GPCR signaling particularly mediated by ADM in orchestrating metabolic reprogramming and immune modulation in LUAD. ADM emerges as a potential predictive biomarker and therapeutic target, offering valuable implications for optimizing strategies.

Keywords: ADM; GPCR signaling; immune microenvironment; lung adenocarcinoma; metabolic reprogramming; prognostic model.


Conflict of interest statement

The authors declare that the research was conducted in the absence of any commercial or financial relationships that could be construed as a potential conflict of interest.

Figures

Figure 1
Figure 1
Identification of GPCR heterogeneity in LUAD patients. (A) Consensus matrix heatmap analysis. (B) Survival analysis of LUAD subgroups. (C) Volcano plot of differentially expressed genes between cluster 2 and 3. (D, E) Barplot showing the functional enrichment of using GO enrichment analysis. (F) Differential pathways were identified via GSEA analysis. (G-J) The enriched metabolism related pathway survival analysis based on ssGSEA score.
Figure 2
Figure 2
A consensus prognostic GPCRscore model was developed and validated. (A) Forest plot showing prognosis-associated GPCR signaling genes using univariate regression analysis. (B, C) Least absolute shrinkage and selection operator (LASSO) Cox regression were used to determine the optimal lambda and corresponding coefficients of the four indicators. (D) Kaplan–Meier curves of OS according to the GPCRscore in TCGA-LUAD (log-rank test: P <0.0001). (E) The diagnostic receiver operating characteristic (ROC) curve and time-related ROC curve confirmed the accuracy and stability of GPCRscore in predicting the prognosis of patients with TCGA-LUAD. (F) Kaplan–Meier curves of OS according to the GPCRscore in GSE31210 (log-rank test: P <0.0001). (G) The ROC curve and time-related ROC curve confirmed the accuracy and stability of GPCRscore in predicting the prognosis of patients with GSE31210. (H) Kaplan–Meier curves of OS according to the GPCRscore in EAS cohort (log-rank test: P =0.0069). (I) The ROC curve and time-related ROC curve confirmed the accuracy and stability of GPCRscore in predicting the prognosis of patients with EAS cohort.
Figure 3
Figure 3
Transcriptional characteristics, genomic profiling, and immune infiltration in high-GPCRscore and low-GPCRscore LUAD patients. (A) The volcano plot of differential gene expressions in high-GPCRscore and low-GPCRscore group. The two vertical dashed lines represent absolute foldchange>2 in gene expression, and the horizontal dashed line denotes adjusted P-value cutoff 0.05. (B) Barplot showing the biological process of GO enrichment analyses in high- and low-GPCRscore group. (C) GSEA enrichment analyses of KEGG gene sets exhibited functional enrichment in high- and low-GPCRscore group. (D) Waterfall plot showing mutation profiles in the high- and low-GPCRscore group. (E) Violin plot illustrating the distribution of tumor mutational burden (TMB) across different risk groups. (F) Heatmap showing immune cell infiltration in the high- and low-GPCRscore group across four distinct computational methods including ESTIMATE, EPIC, quantiseq, and TIMER. (G) Representative staining of tumor-infiltrating lymphocytes from the H&E images in the high- and low-GPCRscore group. Barplot showing the GPCRscore across different mappings of TILs.
Figure 4
Figure 4
ADM as a key GPCR-associated gene linking metabolism and immune suppression. (A) Correlation heatmap showing the correlation between expression level of 13 genes in GPCRscore and metabolic enrichment score. (B) The expression of ADM in the different stage and pathological grade of LUAD patients. (C) Scatter plot showing the correlation between ADM and immune cells. (D) Survival analysis of ADM expression in immunotherapy cohorts. (E) Scatter plot showing the correlation between ADM and immunosuppressive checkpoint including PDCD1, IDO1, HAVCR2, and LAG3.
Figure 5
Figure 5
ADM expression in single-cell sequencing and pathological tissue. (A) UMAP plot showing cell types in GSE148071. (B) ADM expression in GSE148071. (C) Violin plot showing ADM expression in different cell types in GSE148071. (D) UMAP plot showing cell types in GSE162498. (E) ADM expression in GSE162498. (F) Violin plot showing ADM expression in different cell types in GSE162498. (G) UMAP plot showing cell types in GSE117570. (H) ADM expression in GSE117570. (I) Violin plot showing ADM expression in different cell types in GSE117570. (J) IHC staining of ADM in normal lung tissue and LUAD tissue from HPA database. (K) IHC staining of ADM in para-cancerous tissue (n=6) and LUAD tissue (n=6) from our center. The H-score showing the degree of positivity. Statistic tests: two-sided t test. Significance levels are denoted as *P<0.05, **P<0.01, ***P<0.001, ****P<0.0001. Scale bar: 100μm.
Figure 6
Figure 6
ADM expression in peripheral blood and spatial transcriptomics of LUAD patients. (A–D) Violin plot showing the level of adrenomedullin in different clinical stages (A), stage T (B), stage N (C), and stage M (D) of LUAD patients. (E–H) ROC curves showing diagnostic efficiency to evaluate the sensitivity, specificity, and the area under the ROC curves (AUC) for differentiating different clinical stages (E), stage T (F), stage N (G), and stage M (H) of LUAD patients. All ROC curve analyses were significant (p < 0.0001 from AUC of 0.5). (I) Spatial distribution of malignant cells inferred by SpaCET deconvolution. (J, K) Spatial enrichment of purine metabolism and pyrimidine metabolism pathway activity, demonstrating elevated metabolic activity in tumor-dense areas. (L–P) ADM, CD8A, PDCD1, IDO1, and HAVCR2 expression in spatial transcriptomics. Statistic tests: one-way ANOVA. Significance levels are denoted as *P<0.05, **P<0.01, ***P<0.001, ****P<0.0001.
Figure 7
Figure 7
ADM promotes tumor cells proliferation, migration, invasion, and pro-angiogenesis in vitro and in vivo. (A) Barplot showing the mRNA level of ADM in LUAD cells (A549 and H1299) after si-ADM transfection. (B) Cell viability assay to evaluate the impact of si-ADM transfection on the proliferative ability of A549 and H1299 cells. (C) Colony formation assay to assess the impact of si-ADM transfection on the clonogenic capability of A549 and H1299 cells. (D, E) Barplot showing the mRNA level of CDH1, CDH2, MMP2, MMP9, TWIST1, TWIST2, VEGFA, VCAN in LUAD cells (A549 and H1299) after si-ADM transfection. (F, G) Transwell assay to evaluate the impact of si-ADM transfection on the migration and invasion ability of A549 and H1299 cells. (H, I) Endothelial tube-formation assay to evaluate the impact of si-ADM transfection on the promoting angiogenesis ability of A549 and H1299 cells. (J) In vivo LUAD tail vein injection model showing the effect of adrenomedullin on LUAD metastasis. (K, L) Fluorescence images and quantifications of metastatic lesions. (M) Ki-67 antibody was used to detect murine tumor cells. Statistic tests: two-sided t test. Significance levels are denoted as *P<0.05, **P<0.01, ***P<0.001, ****P<0.0001.
Figure 8
Figure 8
ADM suppresses CD8+ T cell proliferation and induces exhaustion. (A) Representative bright-field images of CD8+ T cells cultured with PBS or adrenomedullin (200ng/ml) at 24, 48, and 72 hours. (B) Quantification of CD8+ T cell numbers at 24, 48, and 72 hours. ADM significantly reduced proliferation compared to PBS control. (C) Gating strategy for flow cytometric identification of live CD8+ T cells from culture. (D) Representative flow cytometry showing expression of cytotoxicity marker GZMB and exhaustion markers PD-1 and TIM3 in CD8+ T cells following adrenomedullin (200ng/ml) or PBS treatment at 72 hours. (E) Quantification of GZMB+, PD-1+, and TIM3+ CD8+ T cells. Statistic tests: two-sided t test. Significance levels are denoted as *P<0.05, **P<0.01, ***P<0.001, ****P<0.0001.
Figure 9
Figure 9
ADM-associated metabolic reprogramming and drug sensitivity analysis (A) Kaplan–Meier curves of OS according to ADM in TCGA-LUAD cohort (log-rank test: P <0.0001). (B) Threshold Justification of ADM in TCGA-LUAD. (C) Volcano plot of differentially expressed genes between high expression of ADM and Low expression of ADM. (D) The scatterplot showing the correlation between ADM and the RPPA protein level in TCGA-LUAD. The blue color indicates a significantly negative correlation (P-value < 0.05, Peason's R<-0.3), while the red color represents a significantly positive correlation (P-value < 0.05, Peason's R>0.3). (E) GSEA of DEGs showing the enrichment of tumor metabolic pathways. (F) Barplot showing the mRNA level of PPAT, GMPS, CAD, UMPS, RRM1, and RRM2 in LUAD cells (A549 and H1299) after si-ADM transfection. (G) The scatterplot showing the correlation between the GPCRscore and IC50 values for 198 compounds in TCGA-LUAD. The blue color indicates a significantly negative correlation (P-value < 0.05, Peason's R<-0.2), while the red color represents a significantly positive correlation (P-value < 0.05, Peason's R>0.2). (H) Barplot showing the relative viability of A549 cells treated with Staurosporine or Dasatinib after si-ADM transfection, in comparison with the control group at 48 hours. Statistic tests: two-way ANOVA. Significance levels are denoted as ns, P>0.05, *P<0.05, **P<0.01, ***P<0.001, ****P<0.0001.

Similar articles

References

    1. Siegel RL, Miller KD, Wagle NS, Jemal A. Cancer statistics, 2023. CA: A Cancer J clinicians. (2023) 73:17–48. doi: 10.3322/caac.21763 - DOI - PubMed
    1. Pakkala S, Ramalingam SS. Personalized therapy for lung cancer: striking a moving target. JCI insight. (2018) 3:e120858. doi: 10.1172/jci.insight.120858 - DOI - PMC - PubMed
    1. Liu B, Zhou H, Tan L, Siu KTH, Guan XY. Exploring treatment options in cancer: Tumor treatment strategies. Signal transduction targeted Ther. (2024) 9:175. doi: 10.1038/s41392-024-01856-7 - DOI - PMC - PubMed
    1. Huang K, Han Y, Chen Y, Shen H, Zeng S, Cai C. Tumor metabolic regulators: key drivers of metabolic reprogramming and the promising targets in cancer therapy. Mol cancer. (2025) 24:7. doi: 10.1186/s12943-024-02205-6 - DOI - PMC - PubMed
    1. Zhang M, Chen T, Lu X, Lan X, Chen Z, Lu S. G protein-coupled receptors (GPCRs): advances in structures, mechanisms, and drug discovery. Signal transduction targeted Ther. (2024) 9:88. doi: 10.1038/s41392-024-01803-6 - DOI - PMC - PubMed

MeSH terms

Substances