. 2025 Jun 15;17(6):105160.
doi: 10.4251/wjgo.v17.i6.105160.

Identification and validation of extracellular matrix-related genes in the progression of gastric cancer with intestinal metaplasia

Affiliations

Identification and validation of extracellular matrix-related genes in the progression of gastric cancer with intestinal metaplasia

Lu Wang et al. World J Gastrointest Oncol. .

Abstract

Background: Gastric cancer (GC) is a highly lethal malignancy with a high incidence and mortality rate globally. Its development follows the Correa model, with intestinal metaplasia (IM) being a critical precursor to GC. However, the mechanisms underlying IM progression to GC remain unclear. This study explored extracellular matrix (ECM)-related gene changes during IM progression to GC, aiming to identify biomarkers that could improve early diagnosis and treatment strategies for GC, ultimately enhancing patient outcomes.

Aim: To analyze transcriptome sequencing data, molecular biomarkers that can predict GC risk and monitor IM progression can be identified, providing new insights and strategies for preventing IM-GC transformation.

Methods: Weighted gene co-expression network analysis served for confirming gene modules. Upregulated ECM-related genes were further tested using univariate Cox regression and least absolute shrinkage and selection operator analysis to select hub genes and construct a survival analysis model. The intestinal cell model was established by stimulating GES-1 cells with chenodeoxycholic acid.

Results: Weighted gene co-expression network analysis identified 1709 differentially expressed genes from the GSE191275 dataset, while The Cancer Genome Atlas stomach adenocarcinoma revealed 4633 differentially expressed genes. The intersection of these datasets identified 71 upregulated and 171 downregulated genes, which were enriched in ECM-related pathways. Univariate Cox regression analysis identified six genes with prognostic significance, and least absolute shrinkage and selection operator regression pinpointed secreted protein acidic and rich in cysteine (SPARC) and SERPINE1 as non-zero coefficient genes. A prognostic model integrating clinical tumor node metastasis staging, age, SERPINE1, and SPARC was constructed. Immunohistochemistry analysis confirmed an increasing expression of SPARC protein from normal gastric mucosa (-), to IM (+- to +), and to GC (+ to ++), with significant differences (P < 0.05). Western blot analysis demonstrated significantly higher SPARC expression in induced intestinal cells compared to GES-1. Furthermore, after SPARC knockdown in the human GC cell line HGC27, cell counting kit-8 and colony formation assays showed a reduction in cell proliferative ability, while the wound healing assay revealed impaired cell migration capacity.

Conclusion: Comprehensive analysis suggested that a model incorporating clinical tumor node metastasis staging, age, and SPARC/SERPINE1 expression served as a prognostic predictor for GC. Moreover, elevated SPARC expression in IM and GC suggests its potential as a proper biomarker to detect GC in early stage and as a novel therapeutic target, guiding clinical applications.

Keywords: SERPINE1; Extracellular matrix; Gastric cancer; Intestinal metaplasia; SPARC.


Conflict of interest statement

Conflict-of-interest statement: The authors declare that they have no conflicts of interest.

Figures
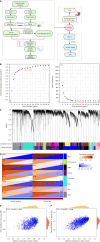
Figure 1
Figure 1
Flowchart and weighted gene co-expression network analysis. A: Flowchart of research; B: The optimal β soft threshold was determined as 12 through scale-free topology and average connectivity analysis; C: Cluster analysis of characteristic gene modules resulted in the identification of eight modules; D-F: Heatmaps showed the correlation between phenotypes and characteristic gene modules confirmed black membership and blue membership as hub modules. GEO: Gene Expression Omnibus; TCGA: The Cancer Genome Atlas; STAD: Stomach adenocarcinoma; IM: Intestinal metaplasia; GC: Gastric cancer; ECM: Extracellular matrix; LASSO: Least absolute shrinkage and selection operator; WGCNA: Weighted gene co-expression network analysis; DEGs: Differentially expressed genes; CDCA: Chenodeoxycholic acid; WB: Western blot; IHC: Immunohistochemistry; SPARC: Secreted protein acidic and rich in cysteine.
Figure 2
Figure 2
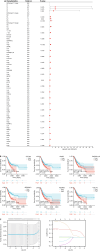
The Cancer Genome Atlas-stomach adenocarcinoma volcano plot and intersection gene analysis. A: Volcano plot for differentially expressed genes (DEGs) between normal and gastric cancer in The Cancer Genome Atlas-stomach adenocarcinoma (STAD); B and C: Venn diagram of the intersection of hub genes in intestinal metaplasia with DEGs in STAD; D and E: Gene Ontology and Kyoto Encyclopedia of Genes and Genomes enrichment results of upregulated DEGs; F and G: Downregulated DEGs; H: The Venn diagram of the intersection of hub genes in intestinal metaplasia, upregulated DEGs in STAD, and genes related to the extracellular matrix; I: A heatmap of the expression of 18 intersecting genes in GSE191275; J: A heatmap of the expression of 18 intersecting genes in The Cancer Genome Atlas-STAD. DEGs: Differentially expressed genes; GO: Gene Ontology; KEGG: Kyoto Encyclopedia of Genes and Genomes; ECM: Extracellular matrix.
Figure 3
Figure 3
Prognostic analysis of intersecting genes and model establishment. A: Forest plot of univariate regression analysis for 18 genes in The Cancer Genome Atlas-stomach adenocarcinoma dataset; B: Kaplan-Meier curve plot of six genes exhibiting an obvious relevance to overall survival; C: Least absolute shrinkage and selection operator analysis of six genes based on prognostic information from The Cancer Genome Atlas-colon adenocarcinoma. HR: Hazard ratio; CI: Confidence interval; SPARC: Secreted protein acidic and rich in cysteine.
Figure 4
Figure 4
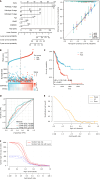
The establishment and validation of prognostic models. A: Nomogram and prognostic calibration curve constructed based on clinical tumor node metastasis stage, age, and hub genes; B: Risk factor plot based on secreted protein acidic and rich in cysteine/SERPINE1 expression and risk score in the Cancer Genome Atlas-stomach adenocarcinoma dataset; C: Prognostic analysis and Kaplan-Meier curve for the two risk groups; D: Prognostic receiver operating characteristic curves at 1-year/2-year/3-year based on secreted protein acidic and rich in cysteine/SERPINE1 risk scores in the The Cancer Genome Atlas-stomach adenocarcinoma dataset; E: The decision curve analysis curve; F: The clinical impact curve. HR: Hazard ratio; TPR: True positive rate; FPR: False positive rate; AUC: Area under the curve; SPARC: Secreted protein acidic and rich in cysteine.
Figure 5
Figure 5
Secreted protein acidic and rich in cysteine/SERPINE1 immunoinfiltration analysis. A and B: Secreted protein acidic and rich in cysteine (A) and SERPINE1 (B) in the data set the Cancer Genome Atlas (TCGA)-stomach adenocarcinoma (STAD) immune infiltration lollipop plot; C and D: Scatter plots of correlation between secreted protein acidic and rich in cysteine and major immune cells in TCGA-STAD (C) and between SERPINE1 and major immune cells in TCGA-STAD (D). NK: Natural killer; DC: Dendritic cells; iDC: Immature dendritic cells; pDC: Plasmacytoid dendritic cells; TFH: T follicular helper; aDC: Activated dendritic cells; CD: Cluster of differentiation; TPM: Transcripts per million; SPARC: Secreted protein acidic and rich in cysteine; Th: T helper cells; Treg: Regulatory T cells; Tgd: T gamma delta cells; Tcm: T central memory cells.
Figure 6
Figure 6
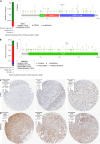
Genetic variation analysis and immunohistochemistry results in Human Protein Atlas of secreted protein acidic and rich in cysteine/SERPINE1. A: Secreted protein acidic and rich in cysteine mutation analysis results; B: SERPINE1 mutation analysis results; C and D: Immunohistochemical images of Secreted protein acidic and rich in cysteine (C) and SERPINE1 (D) in normal gastric mucosa tissues and gastric cancer. SPARC: Secreted protein acidic and rich in cysteine.
Figure 7
Figure 7
Prognostic model validation and hub gene analysis. A: Prognosis model in the GSE15459 dataset risk score Kaplan-Meier curve; B: Prognostic model in the GSE15459 dataset risk factor map; C: The time-varying prognostic receiver operating characteristic curve of the prognostic model in the GSE15459 dataset; D: TNFRSF11B COL1A1, COL3A1, SERPINE1, secreted protein acidic and rich in cysteine (SPARC), PDGFRB in diagnosis of least absolute shrinkage and selection operator GSE191275 dataset regression coefficient; E: Two variables with non-zero regression coefficients generated by the least absolute shrinkage and selection operator analysis in GSE191275: SPARC/TNFRSF11B; F and G: SPARC expression in The Cancer Genome Atlas (TCGA)-stomach adenocarcinoma (STAD) unpaired samples and paired samples; H: Expression of SPARC in normal gastric mucosa and intestinal metaplasia samples of GSE191275; I and J: SPARC was expressed in TCGA-STAD dataset at different clinical stages; K: Low and high SPARC expression groups had obviously different survivals in TCGA-STAD, clinical stage IV, T3T4 and N2N3 (P < 0.05); L: Radar map of SPARC expression in pancarcinoma; M: Prognosis and overall survival of SPARC in pancarcinoma. aP < 0.001. HR: Hazard ratio; TPR: True positive rate; FPR: False positive rate; TPM: Transcripts per million; AUC: Area under the curve; ACC: Adrenocortical carcinoma; BLCA: Bladder urothelial carcinoma; BRCA: Breast invasive carcinoma; CESC: Cervical squamous cell carcinoma and endocervical adenocarcinoma; CHOL: Cholangiocarcinoma; COAD: Colon adenocarcinoma; DLBC: Lymphoid neoplasm diffuse large B-cell lymphoma; ESCA: Esophageal carcinoma; GBM: Glioblastoma multiforme; HNSC: Head and neck squamous cell carcinoma; KICH: Kidney chromophobe; KIRC: Kidney renal clear cell carcinoma; KIRP: Kidney renal papillary cell carcinoma; LAML: Acute myeloid leukemia; LGG: Brain lower grade glioma; LIHC: Liver hepatocellular carcinoma; LUAD: Lung adenocarcinoma; LUSC: Lung squamous cell carcinoma; MESO: Mesothelioma; OV: Ovarian serous cystadenocarcinoma; PAAD: Pancreatic adenocarcinoma; PRAD: Prostate adenocarcinoma; PCPG: Pheochromocytoma and paraganglioma; READ: Rectum adenocarcinoma; SARC: Sarcoma; SKCM: Skin cutaneous melanoma; STAD: Stomach adenocarcinoma; TGCT: Testicular germ cell tumors; THCA: Thyroid carcinoma; THYM: Thymoma; UCS: Uterine carcinosarcoma; UVM: Uveal melanoma; UCEC: Uterine corpus endometrial carcinoma; SPARC: Secreted protein acidic and rich in cysteine.
Figure 8
Figure 8
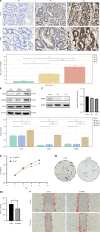
Secreted protein acidic and rich in cysteine expression in tissues and cells. A: The immunohistochemistry results of secreted protein acidic and rich in cysteine (SPARC) in normal gastric mucosa, intestinal metaplasia (IM), and gastric cancer tissue; B: The western blot results of IM markers KLF4, CDX2, and SPARC in GES-1 cell line and chenodeoxycholic acid-induced GES-1 IM cell model; C: The validation results of SPARC knockdown by small interfering (si)-RNA through WB and quantitative real-time polymerase chain reaction; D: The line graph assessing cell proliferation by cell counting kit 8 assay after SPARC knockdown with small interfering (si)-RNA; E: The results of the colony formation assay after SPARC knockdown with si-RNA; F: The results of the cell wound healing assay after SPARC knockdown with si-RNA. aP < 0.001, bP < 0.01, cP < 0.05. NC: Normal control; IM: Intestinal metaplasia; GC: Gastric cancer; IHC: Immunohistochemistry; DMSO: Dimethyl sulfoxide; CDCA: Chenodeoxycholic acid; OD: Optical density; si-NC: Small interfering-normal control; si-SPARC: Small interfering-secreted protein acidic and rich in cysteine; SPARC: Secreted protein acidic and rich in cysteine.

Similar articles

References

    1. Bray F, Ferlay J, Soerjomataram I, Siegel RL, Torre LA, Jemal A. Global cancer statistics 2018: GLOBOCAN estimates of incidence and mortality worldwide for 36 cancers in 185 countries. CA Cancer J Clin. 2018;68:394–424. - PubMed
    1. Smyth EC, Nilsson M, Grabsch HI, van Grieken NC, Lordick F. Gastric cancer. Lancet. 2020;396:635–648. - PubMed
    1. Sung H, Ferlay J, Siegel RL, Laversanne M, Soerjomataram I, Jemal A, Bray F. Global Cancer Statistics 2020: GLOBOCAN Estimates of Incidence and Mortality Worldwide for 36 Cancers in 185 Countries. CA Cancer J Clin. 2021;71:209–249. - PubMed
    1. Correa P. Human gastric carcinogenesis: a multistep and multifactorial process--First American Cancer Society Award Lecture on Cancer Epidemiology and Prevention. Cancer Res. 1992;52:6735–6740. - PubMed
    1. Correa P, Shiao YH. Phenotypic and genotypic events in gastric carcinogenesis. Cancer Res. 1994;54:1941s–1943s. - PubMed

LinkOut - more resources