. 2025 Jun 9:53:82-98.
doi: 10.1016/j.jot.2025.05.005. eCollection 2025 Jul.

Construction of cartilaginous organoids based on cartilage extracellular matrix microcarriers to promote articular cartilage regeneration through immune regulation

Affiliations

Construction of cartilaginous organoids based on cartilage extracellular matrix microcarriers to promote articular cartilage regeneration through immune regulation

Hongyu Jiang et al. J Orthop Translat. .

Abstract

Objective: To investigate the feasibility of constructing cartilaginous organoids (CORGs) using cartilage extracellular matrix microcarriers (CEMMs), evaluate their ectopic chondrogenic potential, and analyze their impact on in situ repair and regeneration of knee cartilage in SD rats.

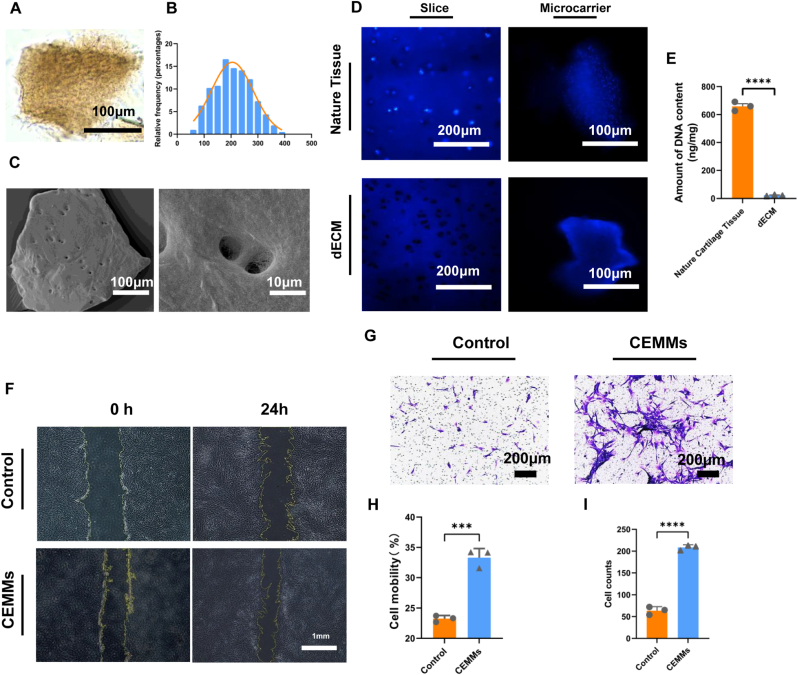
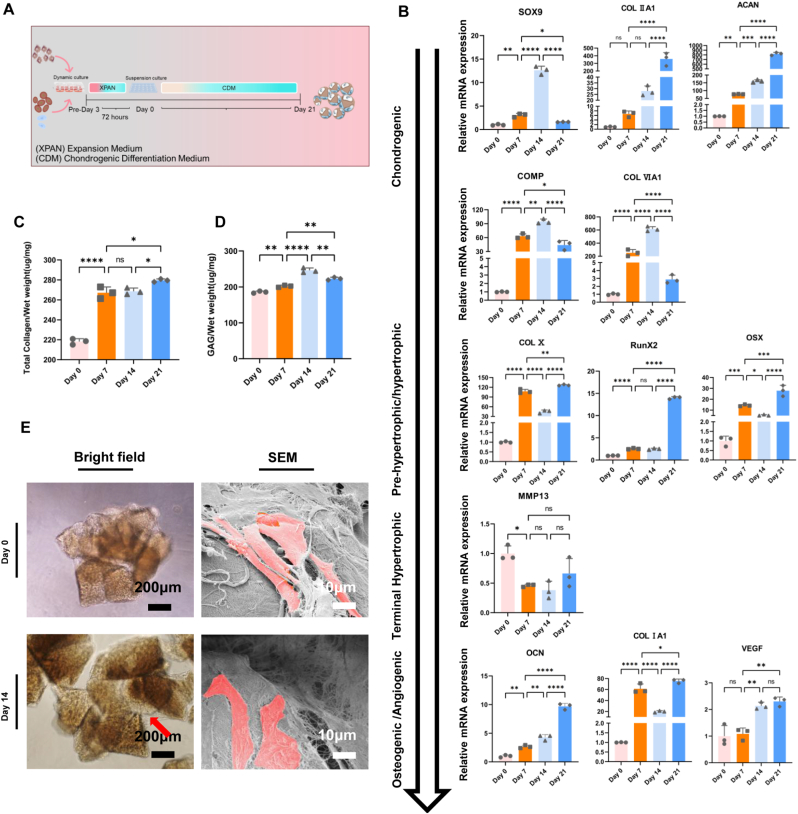
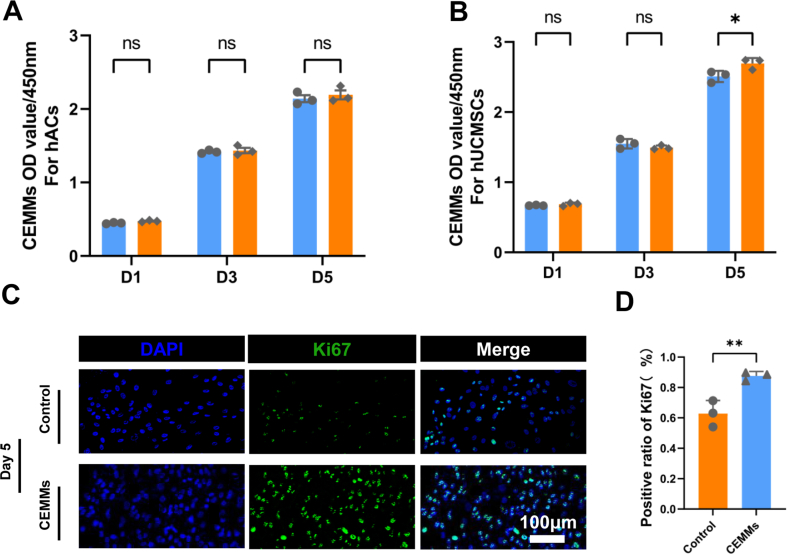
Methods: Cartilage extracellular matrix microcarriers (CEMMs) were created through a combination of decellularization, wet milling, and layered sieving methods. The evaluation of their biological function was conducted through live/dead staining, CCK-8 assay, scratch assay, and Transwell assay in a laboratory setting. The immune microenvironment was confirmed to be influenced by CEMMs through a conditioned culture involving rat macrophages. qRT-PCR and secretory function assays was conducted to evaluate the chondrogenic activity of CORGs. Gene expression profiles throughout the development of CORGs were analyzed using transcriptome sequencing. Immunodeficient mouse subcutaneous model to assess the ectopic chondrogenic capacity of CORGs. CORGs were implanted into the knee joint cartilage defects of SD rats to evaluate their effects on cartilage regeneration.

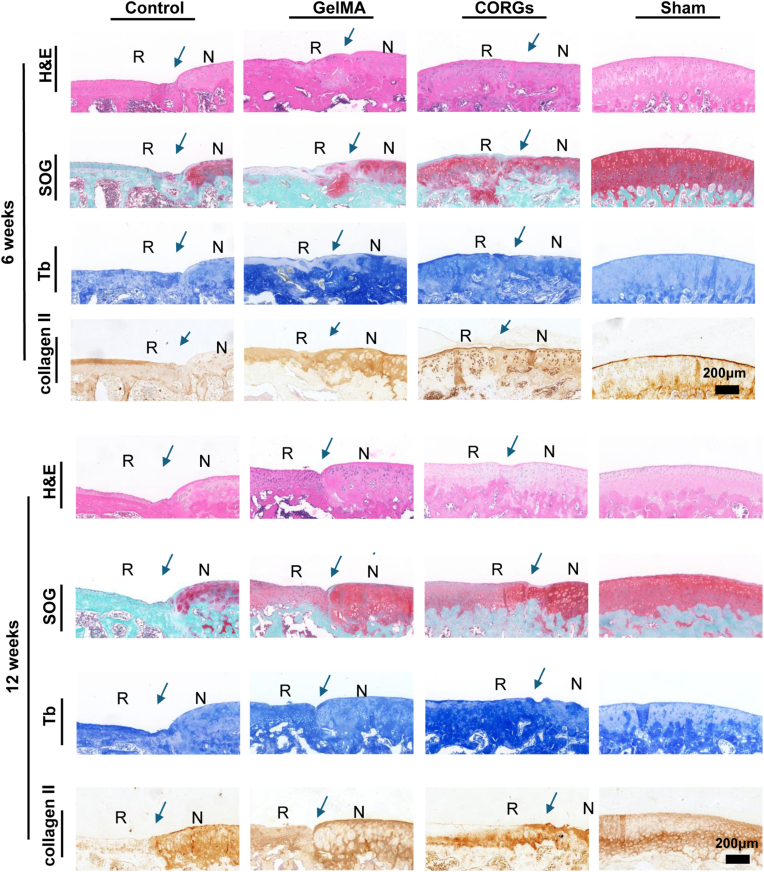
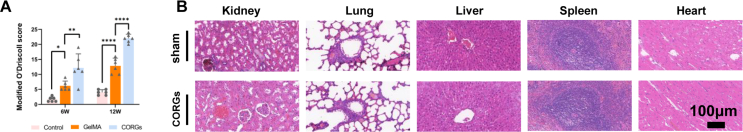
Results: Successfully developed CEMMs with dimensions of 210.4 ± 56.89 um exhibited strong biocompatibility, the capacity to draw in stem cells, stimulate their growth and migration, and encourage macrophages to shift to the M2 type. Functionalized CORGs were successfully constructed based on CEMMs. Transcriptomics showed that CORGs had a gene expression pattern similar to mesodermal to chondrogenic development. CORGs successfully generated cartilaginous tissue subcutaneously in immunodeficient mice. Specifically, at 1 week postoperatively, CORGs were observed to promote M2 polarization of periarticular macrophages. At 6 and 12 weeks post-surgery, gross observation, micro-CT scanning, and histological analyses collectively revealed that CORGs promoted cartilage regeneration.

Conclusions: The functionalized CORGs was successfully constructed based on CEMMs, exhibiting robust expression of chondrogenic-related genes and demonstrating the ability to secrete collagen and GAGs. Transcriptomic analysis revealed that CORGs exhibited a gene expression trajectory consistent with the transition from mesodermal to chondrogenic genes, resulting in the successful development of cartilaginous tissues rich in cartilage-specific matrix when implanted subcutaneously in immunodeficient mice. Furthermore, CORGs demonstrated the ability to modulate the immune microenvironment surrounding the knee joint. In SD rat models of knee cartilage defects, CORGs exhibited robust regenerative and repair capacity.

The translational potential of this article: This research involved the creation of CORGs utilizing natural biomaterials (ECM) and MSCs, demonstrating significant promise for treating cartilage injuries, thereby paving the way for innovative strategies in cartilage tissue regeneration engineering.

Keywords: Cartilage extracellular matrix microcarriers; Cartilage regeneration; Cartilaginous organoids; Immune regulation..


Conflict of interest statement

The authors declare that they have no conflict of interest.

Figures

Image 1
To show the design principle and process diagram of constructing cartilaginous organoids(CORGs) based on CEMMs. CEMMs were derived from pig cartilage by employing a process that included decellularization, moist grinding and layered sieving techniques. It was verified that CEMMs could promote cell proliferation, migration and macrophage polarization to M2. CORGs were constructed by loading hUCMSCs with hACs, and CORGs were able to form cartilaginous tissues subcutaneously in immunodeficient mice and successfully repaired knee joint defects in rats.
Fig. 1
Fig. 1
To show the design principle and process diagram of constructing cartilaginous organoids (CORGs) based on CEMMs. CEMMs were derived from pig cartilage by employing a process that included decellularization, moist grinding and layered sieving techniques. It was verified that CEMMs could promote cell proliferation, migration and macrophage polarization to M2. CORGs were constructed by loading hUCMSCs with hACs, and CORGs were able to form cartilaginous tissues subcutaneously in immunodeficient mice and successfully repaired knee joint defects in rats.
Fig. 2
Fig. 2
Characterization and biological characteristics of Chondrocyte extracellular matrix microcarriers (CEMMs). A) Optical images of CEMMs. Scale bars: 100 μm. B) Particle size quantification of CEMMs. C) Scanning Electron Microscopy (SEM) images of CEMMs. Scale bars: 100 μm (left), 10 μm (right). D) Fluorescence staining images of cartilage tissue and microcarriers before and after decellularization Scale bars: 200 μm (left), 100 μm (right). E) Quantitative DNA Analysis of native cartilage tissue and dECM (n = 3). F) The microscopic images of scratch line at 0, 24h in Control and CEMMs groups. G) Microscopic images of the two groups of Transwell experiments. H) Quantitative assessment of the cell mobility of two groups of hUCMSCs (n = 3). I) Quantitative assessment of cell migration counts in two groups (n = 3). ∗∗∗p < 0.001, ∗∗∗∗p < 0.0001.
Fig. 3
Fig. 3
Effect of CEMMS on the polarization of rat macrophages. A) Quantitative analysis of M1 macrophage-related phenotypes using real-time PCR (n = 3). B) Quantitative analysis of M2 macrophage-related phenotypes using real-time PCR (n = 3). C) Immunofluorescence staining for markers of macrophages(CD86; Green)/(CD206; Red). Scale bars: 100 μm. D) Quantitative analysis of immunofuorescence staining. E) Immunofluorescence staining for markers of macrophages (Arg-1; Green)/(IL-1β; Red). Scale bars: 100 μm. F) Quantitative analysis of immunofuorescence staining. ∗∗∗∗p < 0.0001.
Fig. 4
Fig. 4
Construction of functionalized cartilaginous organoids based on CEMMs. A) Schematic representing the strategy for construction strategy of CORGs. The hUCMSCs were mixed with hACs at 3:1 and added to the rotating bioreactor at a total cell number of 2 × 104/mg with CEMMs. Pre-day 3 to day 0 were cultured using XPAN medium, and on day 0, the culture medium was removed, and the cells were placed on ultra-low adhesion 24-well plates for suspension culture. Then, CDM was added, and the cells were cultured for 21 days. The CDM medium was changed every three days during this period. B) Quantitative real-time PCR analysis of biomarkers related to chondrogenic development stage. Including chondrogenic (SOX9、COLⅡA1、ACAN、COMP、COLⅥA1)、Pre-hypertrophic/hypertrophic (COLⅩ、RUNX2、OSX) 、Terminal Hypertrophic (MMP13)、Osteogenic/Angiogenic (COLⅠA1、OCN、VEGF) biomarkers at four developmental stages(n = 3). C) Quantification of total collagen content of CORGs at different time periods(n = 3). D) Quantification of GAG content of CORGs at different time periods(n = 3). E) Light and scanning electron microscopy images of 0 days and 14 days CORGs. Scale bars: 200 μm (left), 10 μm (right). ∗p < 0.05, ∗∗p < 0.01, ∗∗∗p < 0.001, ∗∗∗∗p < 0.0001, n.s. represents no significant difference.
Fig. 5
Fig. 5
During chondrogenic differentiation, CORGs follow the expression pattern of mesodermal to chondrogenic developmental genes. A) Principal Component Analysis. There is minimal intra-group variability on PC1, indicating a high level of data authenticity and validity. B) Venn diagram. The different groups of CORGs have the same and different genes. C) Up-enrichment GO pathways of D7 vs. D0. D) Up-enrichment GO pathways of D14 vs. D7. E) Up-enrichment GO pathways of D21 vs. D14. F) Up-enrichment KEGG pathways of D7 vs. D0. G) Up-enrichment KEGG pathways of D14 vs. D7. H) Up-enrichment KEGG pathways of D21 vs. D14. I) Overview of the normalized heatmap by RNA sequencing depicting the representative genes for each group related to associated genes of Cartilage hypertrophy and mineralization. (Three independent pairs of samples were from the same mother cells.)
Fig. 6
Fig. 6
Formation of new cartilaginous tissue by Cartilaginous Organoids in vivo. A) Front and side images of CORGs and GelMA hybrid materials, live and dead fluorescent staining images of hybrid materials, image of Bright field and Calcein fluorescent staining of hybrid materials. B) Image of subcutaneous implantation in immunodeficient mice. C) Gross observation of new cartilaginous tissue from CORGs+GelMA and GelMA. Scale bars: 5mm. D) Histological staining of subcutaneous implants (H&E, Toluidine blue, Collagen II, Safranine O) in CORGs+GelMA group and GelMA group. Scale bars: 200 μm. E) Representative immunofluorescence images of SOX9 fluorescent staining of subcutaneous implants in CORGs+GelMA and GelMA group. Scale bars: 200 μm. F) Representative immunofluorescence images of Human Nuclear (HuNu) fluorescent staining of subcutaneous implants in CORGs+GelMA and GelMA group. Scale bars: 200 μm.
Fig. 7
Fig. 7
Gross and Micro-CT imaging evaluation and scoring. A) Gross observation of femur cartilage after treatment at 6 and 12 weeks. Red circles indicate the defect area. Scale bars: 1 mm. B) Heat map of ICRS macroscopic assessment of cartilage at 6 and 12 weeks. C) ICRS macroscopic scores of repair tissue at 6 and 12weeks (n = 6). D) Micro-CT images showing 3D reconstruction of the repaired cartilage at 6 and 12 weeks postsurgery. Red circles indicate the defect area. E) BMD of cartilage defect repair area 6 and 12 weeks after surgery (n = 3). F) BV/TV of cartilage defect repair area 6 and 12 weeks after surgery (n = 3). ∗p < 0.05, ∗∗p < 0.01, ∗∗∗p < 0.001, ∗∗∗∗p < 0.0001.
Fig. 8
Fig. 8
Histology and immunohistochemistry evaluation. Histological (H&E、safranin O and Toluidine blue staining) and immunohistochemical analyses of the 6 and 12 week defect area. Blue solid arrows indicate the repair interface (N: normal cartilage; R: repaired cartilage). Scale bar = 200 μm.
figs1
figs1
A) H&E, Alcian blue and Safranine O staining of native cartilage tissue and CEMMs. Scale bars: 200 μm. B) Quantitative results of total collagen of natural cartilage tissue and dECM(n=3). C) Quantitative results of GAG of natural cartilage tissue and dECM (n=3).∗∗∗p< 0.001, ∗∗∗∗p< 0.0001.
figs2
figs2
A) Representative Calcein-AM/PI fluorescence images (green, living cell; red, dead cell) of hUCMSCs cultured on CEMMs for 1, 3 and 5 days, Scale bars: 200 μm. B) Representative Calcein-AM/PI fluorescence images (green, living cell; red, dead cell) of hUCMSCs cultured without CEMMs for 1, 3 and 5 days, Scale bars: 100 μm. C) Quantitative evaluation of Calcein-AM/PI fluorescence images of hUCMSCs cultured on CEMMs(n=3). D) Quantitative evaluation of Calcein-AM/PI fluorescence images of hUCMSCs cultured without CEMMs (n=3).
figs3
figs3
A) The viability of hACs cultured on the CEMMs for 1, 3 and 5 days was detected by the CCK8 kit(n=3). B) The viability of hUCMSCs cultured on the CEMMs for 1, 3 and 5 days was detected by the CCK8 kit (n=3). C) Representative immunofluorescence images of the Ki67 staining of hUCMSCs cultured in each group for 5 days. Scale bars:100 μm. D) Positive ratio of the fluorescence of Ki67 in each group (n = 3). ∗p< 0.05, ∗∗p< 0.01, n.s. represents no significant difference.
figs4
figs4
Light microscopy and scanning electron microscopy images of BMDMs in IFN-γ+LPS, NT and CEMMs groups. Scale bars: 50 μm.
figs5
figs5
A) Representative Calcein-AM/PI fluorescence images(green, living cell; red, dead cell) of cells on CPRGs for 0, 7, 14 and 21 days. Scale bars: 200 μm. B) Quantitative evaluation of Calcein-AM/PI fluorescence images of cells on CORGs(n=3).
figs6
figs6
Representative H&E and Toluidine blue staining images of 7, 14 and 21days CORGs. Scale bars: 200μm.
figs7
figs7
A) Multiplex immunofluorescence staining of CORGs. Scale bars: 100μm. B) Quantitative analysis of immunofuorescence staining (n=3). ∗p< 0.05, ∗∗p< 0.01, ∗∗∗p< 0.001, ∗∗∗∗p< 0.0001.
figs8
figs8
Confocal microscopy was utilized to capture representative images of the SOX9/ACAN (Red/Green) immunofluorescence signal at the interface between 14days CORGs and 14days CORGs. Scale bars: 100μm.
figs9
figs9
Overview of the normalized heatmap by RNA sequencing depicting the representative genes for each group related to associated genes of cartilage matrix, antichondrogenic, cartilage matrix formation, chondrogenesis and cartilage differentiation. (Three independent pairs of samples were from the same mother cells.)
figs10
figs10
A) Immunofuorescence staining of M1 macrophage markers (CD86) and M2 macrophage markers (CD206) in synovial tissues. B) Quantitative analysis of immunofuorescence staining for CD86and CD206 in synovial tissue. Scale bars: 200 μm. ∗∗∗∗p< 0.0001.
figs11
figs11
Microct images at 6 and 12 weeks showed subchondral bone reconstruction after repair. The yellow dashed box indicates the defect area.
figs12
figs12
A) Modified O’Driscoll scores of repair tissue at 6 and 12 weeks(n=3). B)H&E staining of heart, liver, spleen, lung and kidney tissues for different groups at 6 weeks post-operation. Scale bar: 100 μm. ∗p< 0.05, ∗∗p< 0.01, ∗∗∗∗p< 0.0001.

References

    1. Jia L., Zhang P., Ci Z., Hao X., Bai B., Zhang W., et al. Acellular cartilage matrix biomimetic scaffold with immediate enrichment of autologous bone marrow mononuclear cells to repair articular cartilage defects. Mater Today Bio. 2022;15 doi: 10.1016/j.mtbio.2022.100310. - DOI - PMC - PubMed
    1. Qi C., Liu J., Jin Y., Xu L., Wang G., Wang Z., et al. Photo-crosslinkable, injectable sericin hydrogel as 3D biomimetic extracellular matrix for minimally invasive repairing cartilage. Biomaterials. 2018;163:89–104. doi: 10.1016/j.biomaterials.2018.02.016. - DOI - PubMed
    1. Fasciani A., D'Annunzio S., Poli V., Fagnocchi L., Beyes S., Michelatti D., et al. MLL4-associated condensates counterbalance Polycomb-mediated nuclear mechanical stress in Kabuki syndrome. Nat Genet. 2020;52:1397–1411. doi: 10.1038/s41588-020-00724-8. - DOI - PMC - PubMed
    1. Koh R.H., Jin Y., Kim J., Hwang N.S. Inflammation-modulating hydrogels for osteoarthritis cartilage tissue engineering. Cells. 2020;9 doi: 10.3390/cells9020419. - DOI - PMC - PubMed
    1. Li Y., Li L., Li Y., Feng L., Wang B., Wang M., et al. Enhancing cartilage repair with optimized supramolecular hydrogel-based scaffold and pulsed electromagnetic field. Bioact Mater. 2023;22:312–324. doi: 10.1016/j.bioactmat.2022.10.010. - DOI - PMC - PubMed

LinkOut - more resources