. 2025 Jun 18:13:e19522.
doi: 10.7717/peerj.19522. eCollection 2025.

Mito-fission gene prognostic model for colorectal cancer

Affiliations

Mito-fission gene prognostic model for colorectal cancer

Chao Liu et al. PeerJ. .

Abstract

Background: Dysregulated cellular metabolism is one of the major causes of colorectal cancer (CRC), including mitochondrial fission. Therefore, this study focuses on the specific regulatory mechanisms of mitochondrial dysfunction on CRC, which will provide theoretical guidance for CRC in the future.

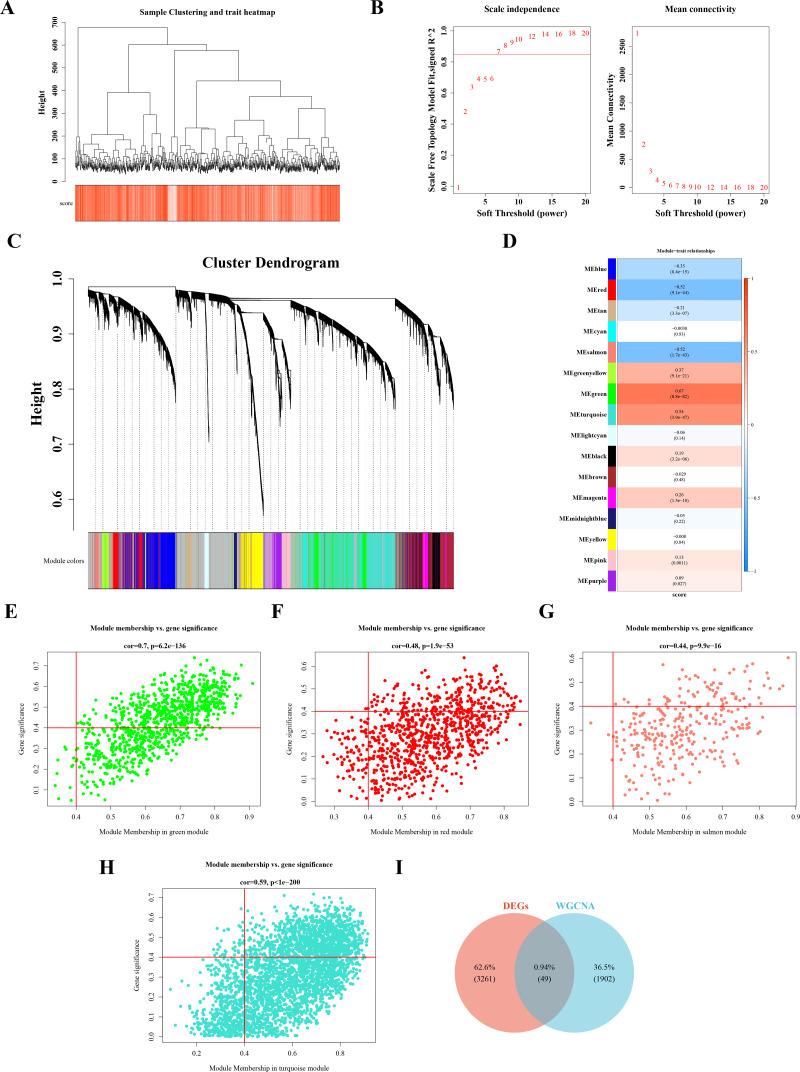
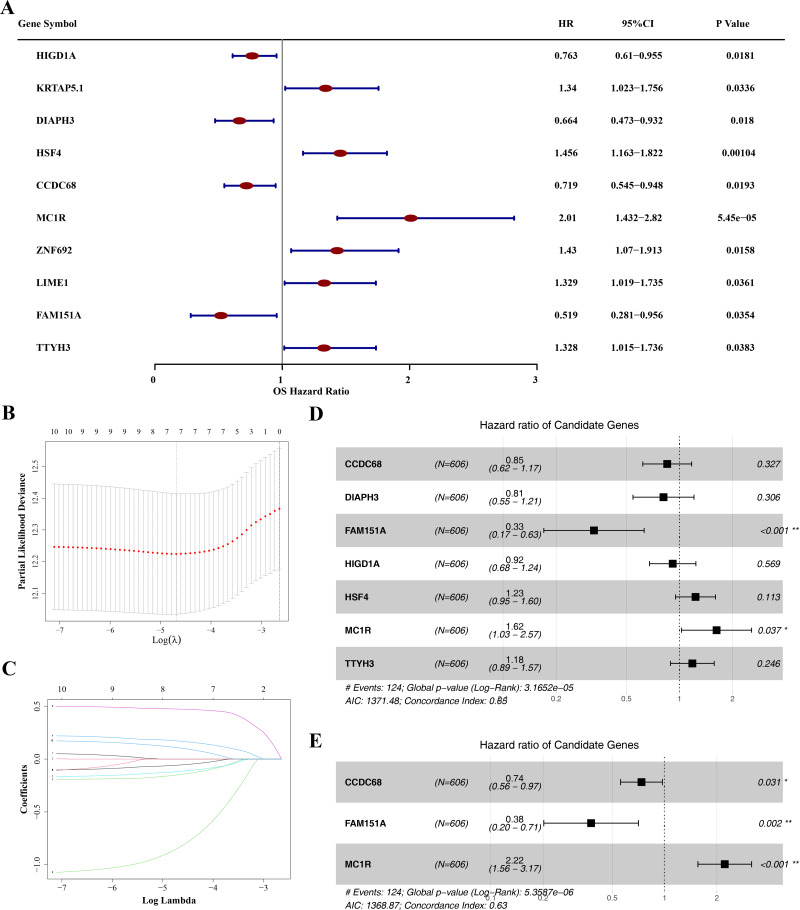
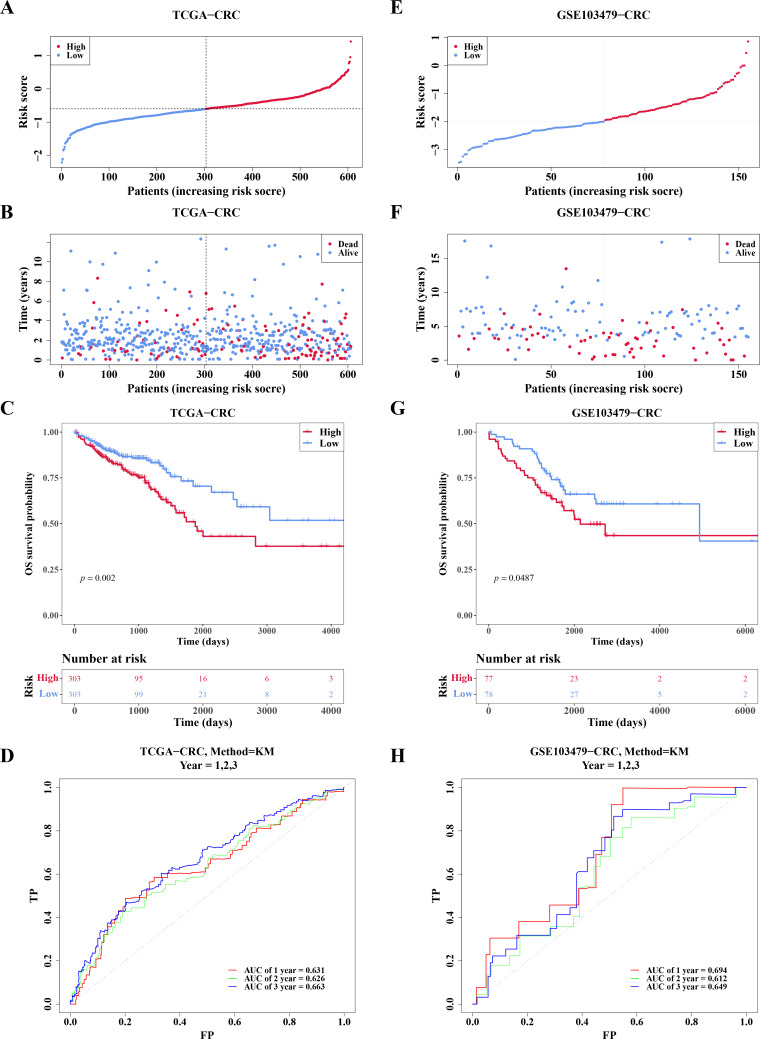
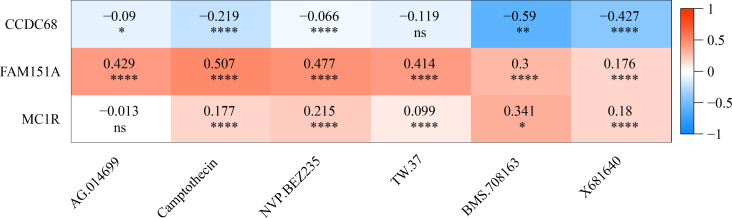
Methods: The Cancer Genome Atlas (TCGA)-CRC dataset, GSE103479 dataset and 40 mitochondrial fission-related genes (MFRGs) were downloaded in this study. The differentially expressed genes (DEGs) were analyzed in TCGA-CRC samples. Using MFRGs scores as traits, key module genes associated with its scores were screened by weighted gene co-expression network analysis (WGCNA). Then, differentially expressed MFRGs (DE-MFRGs) were obtained by intersecting DEGs and key module genes. Next, DE-MFRGs were subjected to univariate Cox, least absolute shrinkage and selection operator (LASSO), multivariate Cox and stepwise regression analysis to scree hub genes and to construct the risk model. The risk model was validated in GSE103479. Finally, the hub genes were comprehensively investigated through a multi-faceted approach encompassing clinical characteristic analysis, Gene Set Enrichment Analysis (GSEA), immune infiltration analysis, and drug sensitivity prediction. Subsequently, the expression levels of the identified key genes were validated utilizing quantitative real-time fluorescence PCR (qRT-PCR), reinforcing the findings and ensuring their accuracy.

Results: The 49 DE-MFRGs were gained by intersecting 3,310 DEGs and 1,952 key module genes. Then, CCDC68, FAM151A and MC1R were screened as hub genes. Also, the risk model validated in GSE103479 showed that the higher the risk score, the worse the survival of CRC patients. Furthermore, T/N/M stages were differences in risk scores between subgroups of clinical characteristics. The memory CD4+ T cell and plasma cell were more significant differences in the low-risk group samples. The 51 drugs were showed a better response in the high-risk group patients. RT-qPCR validation results showed that CCDC68 and FAM151A were down-regulated in CRC, while MC1R was up-regulated, consistent with the validation set results. And FAM151A and MC1R showed highly significant difference between CRC and normal samples (P < 0.0001).

Conclusion: In this study, we found CCDC68, FAM151A and MC1R as potential hub genes in CRC, and analyzed the molecular mechanism of mitochondrial affecting CRC, which would provide theoretical reference value for CRC.

Keywords: Colorectal cancer; Gene; Mitochondria; Pan-cancer analysis; Risk model.


Conflict of interest statement

The authors declare there are no competing interests.

Figures

Figure 1
Figure 1. The expression of DEGs between colorectal cancer group and normal group in TCGACRC samples.
(A) Volcanic map of differentially expressed genes distribution between CRC and Normal groups: red dots are up-regulated genes, green dots are down-regulated genes, and gray dots are undifferentiated genes. (B) Heat map of differentially expressed genes between the CRC group and Normal group: the upper part is the heat map of expression quantity density of the Top20 differentially expressed genes in the sample, showing the lines of five quantiles and average values; the next part is the expression heat map of the top 20 differential genes in the sample. (C) MFRGs score difference among different samples in training set. (D) KM survival curve of high and low MFRGs rating groups. (E) Differences in MFRGs scores among different clinical subgroups.
Figure 2
Figure 2. Acquisition of 49 DE-MFRGs.
(A) Sample level clustering after the introduction of sample traits. (B) Soft threshold selection: the determination of the optimal soft threshold mainly refers to the figure on the left, that is, the scale-free fit index (Y-axis) under different soft thresholds (X-axis), where the red line represents the value of the selected scale-free fit index. From the figure on the left, the value when the scale-free fit index is 0.85 is the minimum soft threshold. The figure on the right shows the network connectivity under different soft thresholds. (C) Identification of co-expression modules: the top half is the hierarchical clustering tree of genes, and the bottom half is the gene module, that is, the network module. Corresponding to the top and bottom, it can be seen that the genes that are close to each other (clustering to the same branch) are divided into the same module. (D) Correlation heat map of modules and phenotypes: the leftmost color block represents the module, and the rightmost color bar represents the correlation range. In the middle part of the heat map, the darker the color, the higher the correlation, red indicates positive correlation, blue indicates negative correlation; The numbers in each cell represent relevance and significance. (E–H) Scatterplot of GS and MM in key modules: GS (Gene Significance) represents the correlation between gene expression and phenotypic data. MM (Module membership) refers to the correlation between gene expression and module. (I) Identification of differential MFRGs related genes.
Figure 3
Figure 3. Biological functions and signaling pathways involved in 49 DE-MFRGs.
(A–D) GO and KEGG enrichment results of differential MFRGS-related genes: color bands on the left represent logFC of genes, and different bands on the right represent different pathways.
Figure 4
Figure 4. Identification of CCDC68, FAM151A and MC1R and risk model construction.
(A) Unifactor Cox regression analysis of forest map. (B) Ten cross-validations of the adjusted parameters in LASSO analysis: the horizontal coordinate is the logarithm of the lambdas, and the vertical coordinate is the model error. The optimal lambda value is at the lowest point of the red curve, and the corresponding number of variables is 7. (C) LASSO coefficient spectrum: the horizontal coordinate is the logarithm of the lambdas, and the vertical coordinate is the variable coefficient. As the lambdas increase, the variable coefficient approaches 0. When the optimal lambda is reached, the variable whose culling coefficient is equal to 0. (D) Multivariate Cox regression analysis of forest map. (E) Stepwise regression analysis of forest map.
Figure 5
Figure 5. Risk model had good predictability for CRC patients.
(A) Risk curves for the high-low risk group of CRC patients in the training set. (B) Scatterplot of the high-low risk grouping of CRC patients in the training set. (C) Survival curves of CRC high-low risk groups in the training set: red represents high risk group, blue represents low risk group. (D) ROC curves of CRC patients at 1, 2 and 3 years of training set. (E) Risk curves of CRC patients in high-low risk groups were validated. (F) Scatter plots of high-low risk groups of CRC patients were validated. (G) Survival curves of the high-low risk group of CRC patients in the validation set. (H) ROC curves of CRC patients at 1, 2, and 3 years were validated.
Figure 6
Figure 6. RiskScore, age and N/M stages were independent prognostic factors for CRC.
(A) Univariate independent prognostic analysis of CRC forest map. (B) Multivariate independent prognostic analysis of CRC forest map. (C) The survival nomogram of CRC patients was constructed based on risk model and clinical features. (D) Calibration curve of clinical feature nomogram: the horizontal axis represents the probability of different clinical outcomes predicted by the model, and the vertical axis represents the probability of actually observed clinical outcomes of patients, which is represented by the form of median plus mean, and an ideal curve with slope of 1 is drawn as a reference. The closer the actual curve is to the ideal curve, the better the calibration degree is, that is, the smaller the deviation between the predicted results of the model and the actual results, the better the model effect. (E) ROC curve of clinical features. (F) Correlation analysis between risk score and clinical features.
Figure 7
Figure 7. Associated pathways of three hub genes and their effects in the immune micro environment.
(A) KEGG enrichment signaling pathway in high-low risk groups: This diagram can be divided into three parts. Part I: The top five lines are the lines of gene Enrichment Score. The vertical axis is the corresponding Running ES, and there is a peak value in the line graph, which is the Enrichemnt score of this gene set, and the genes before the peak value are the core genes under this gene set. The horizontal axis represents each gene under this gene set, corresponding to the bar code-like vertical line in the second part. Part 2: The barcode-like part, called Hits, where each vertical line corresponds to a gene under the gene set. Part 3: Sequencing of genes. (B) Proportion of immune cells in the high-low risk group. (C) Differences in immune cells between high and low risk groups. (D) Differences in 48 immune checkpoints between high and low risk groups. (E) TIDE score difference between high and low risk groups violin chart.
Figure 8
Figure 8. Twenty-seven drugs that perform better in high-risk groups.
The horizontal coordinate is the high-low expression group; the ordinate is IC50.
Figure 9
Figure 9. Twenty-four drugs that perform better in high-risk groups.
The horizontal coordinate is the high-low expression group; the ordinate is IC50.
Figure 10
Figure 10. Ten drugs that perform better in high-risk groups.
The horizontal coordinate is the high and low expression group; the ordinate is IC50.
Figure 11
Figure 11. Gene correlation between chemotherapy drugs and risk model.
Figure 12
Figure 12. Three hub genes linked in other diseases.
(A) Differential analysis of CCDC68 in different samples of pancarcinoma. (B) Differential analysis of FAM151A in different samples of pancarcinoma. (C) Differential analysis of MC1R in different samples of pancarcinoma.
Figure 13
Figure 13. Validation of expression of 3 biomarkers.
(A) Difference analysis of risk model genes in different samples of training set. (B) Expression of CCDC68 in normal samples and CRC samples. (C) Expression of FAM151A in normal samples and CRC samples. (D) Expression of MC1R in normal samples and CRC samples.

Similar articles

References

    1. Boatright KM, Salvesen GS. Caspase activation. Biochemical Society Symposia. 2003:233–242. doi: 10.1042/bss0700233. - DOI - PubMed
    1. Bray F, Laversanne M, Sung H, Ferlay J, Siegel RL, Soerjomataram I, Jemal A. Global cancer statistics 2022: GLOBOCAN estimates of incidence and mortality worldwide for 36 cancers in 185 countries. CA: A Cancer Journal for Clinicians. 2024;74:229–263. doi: 10.3322/caac.21834. - DOI - PubMed
    1. Brueckner LM, Hess EM, Schwab M, Savelyeva L. Instability at the FRA8I common fragile site disrupts the genomic integrity of the KIAA0146, CEBPD and PRKDC genes in colorectal cancer. Cancer Letters. 2013;336:85–95. doi: 10.1016/j.canlet.2013.04.007. - DOI - PubMed
    1. Bugajova M, Raudenska M, Hanelova K, Navratil J, Gumulec J, Petrlak F, Vicar T, Hrachovinova S, Masarik M, Kalfert D, Grega M, Plzak J, Betka J, Balvan J. Glutamine and serum starvation alters the ATP production, oxidative stress, and abundance of mitochondrial RNAs in extracellular vesicles produced by cancer cells. Scientific Reports. 2024;14:25815. doi: 10.1038/s41598-024-73943-2. - DOI - PMC - PubMed
    1. Caldwell CM, Green RA, Kaplan KB. APC mutations lead to cytokinetic failures in vitro and tetraploid genotypes in Min mice. Journal of Cell Biology. 2007;178:1109–1120. doi: 10.1083/jcb.200703186. - DOI - PMC - PubMed

MeSH terms

Substances