. 2024 Aug 26;12(8):e2024EF004493.
doi: 10.1029/2024EF004493.

Estimates of Lake Nitrogen, Phosphorus, and Chlorophyll- a Concentrations to Characterize Harmful Algal Bloom Risk Across the United States

Affiliations

Estimates of Lake Nitrogen, Phosphorus, and Chlorophyll- a Concentrations to Characterize Harmful Algal Bloom Risk Across the United States

Meredith M Brehob et al. Earths Future. .

Abstract

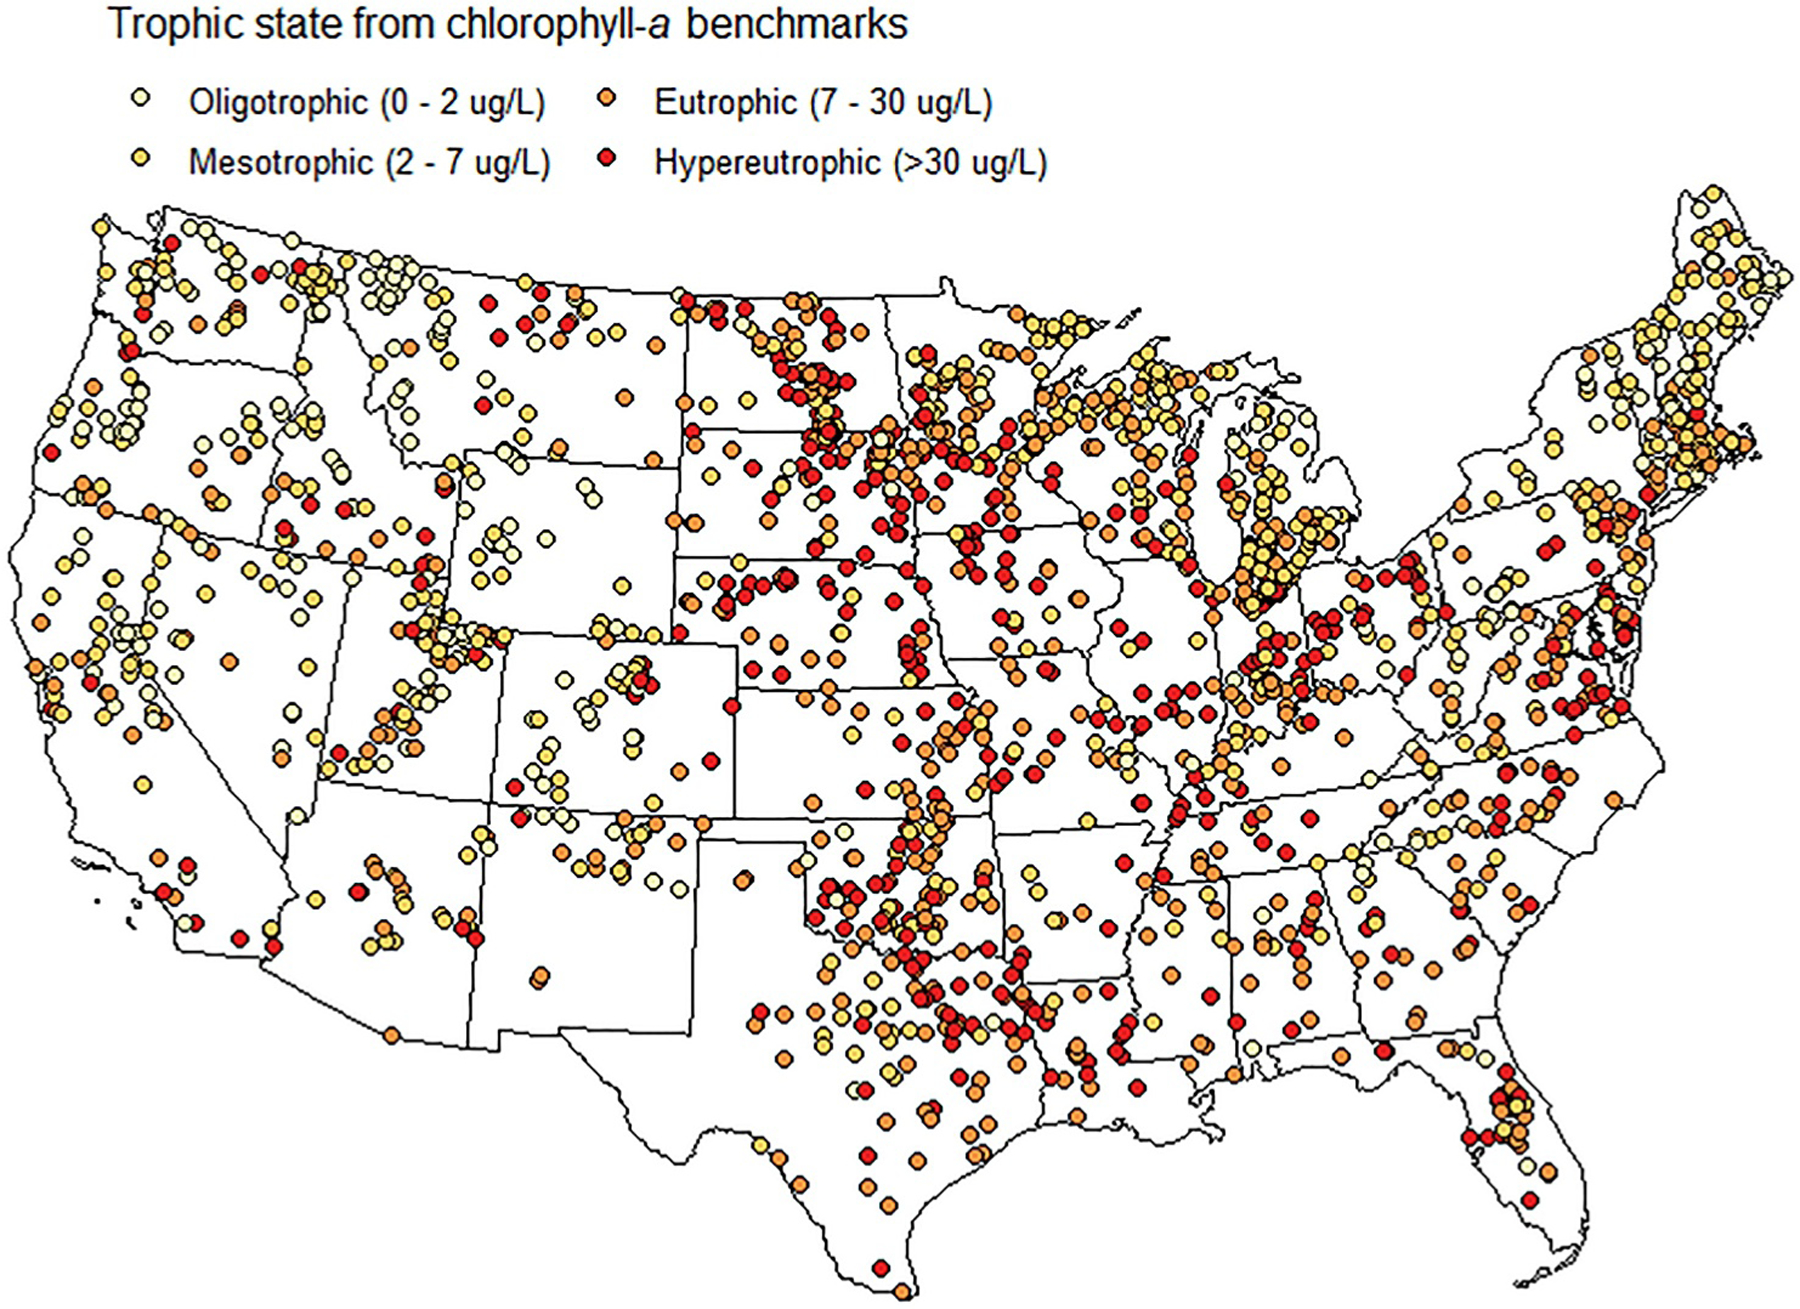
Excess nutrient pollution contributes to the formation of harmful algal blooms (HABs) that compromise fisheries and recreation and that can directly endanger human and animal health via cyanotoxins. Efforts to quantify the occurrence, drivers, and severity of HABs across large areas is difficult due to the resource intensive nature of field monitoring of lake nutrient and chlorophyll-a concentrations. To better characterize how nutrients interact with other environmental factors to produce algal blooms in freshwater systems, we used spatially explicit and temporally matched climate, landscape, in-lake characteristic, and nutrient inventory data sets to predict nutrients and chlorophyll-a across the conterminous US (CONUS). Using a nested modeling approach, three random forest (RF) models were trained to explain the spatiotemporal variation in total nitrogen (TN), total phosphorus (TP), and chlorophyll-a concentrations across US EPA's National Lakes Assessment (n = 2,062). Concentrations of TN and TP were the most important predictors and, with other variables, the RF model accounted for 68% of variation in chlorophyll-a. We then used these RF models to extrapolate lake TN and TP predictions to lakes without nutrient observations and predict chlorophyll-a for ∼112,000 lakes across the CONUS. Risk for high chlorophyll-a concentrations is highest in the agriculturally dominated Midwest, but other areas of risk emerge in nutrient pollution hot spots across the country. These catchment and lake-specific results can help managers identify potential nutrient pollution and chlorophyll-a hot spots that may fuel blooms, prioritize at-risk lakes for additional monitoring, and optimize management to protect human health and other environmental end goals.


Figures

Figure 1.
Figure 1.
Map of the conterminous United States showing 2007 and 2012 National Lakes Assessment (NLA) observations (n = 2,062) used in training Random Forest models. In cases where there are multiple samples for a lake, the most recent sample value is displayed. Point colors represent chlorophyll-a concentrations binned by 2017 NLA trophic state benchmarks.
Figure 2.
Figure 2.
Variable importance rankings for all variables in the final versions of the (a) Total Nitrogen (TN) Random Forest (RF) model, (b) Total Phosphorus (TP) RF model, and (c) Chlorophyll-a RF model. The TN model explained 94% of variance in the training data set and 65% in the validation data set, the TP model explained 93% of variance in the training data set and 62% in the validation data set, and the Chlorophyll-a model explained 94% of variance in the training data set and 68% in the validation data set (Table S5 in Supporting Information S1) Bar colors indicate variable category. Error bars refer to the standard error calculated among the 10 cross-validation runs for each model.
Figure 3.
Figure 3.
Random Forest (RF) partial dependence plots showing the relationship between the top 4 important predictor variables (panel numbers 1–4 refer to importance ranking) and responses from each RF: Total Nitrogen (TN), Total Phosphorus (TP), and Chlorophyll-a (Chla).
Figure 4.
Figure 4.
Maps of the conterminous U.S. showing predictions of chlorophyll-a, TN, and TP for catchments (n = ∼2.5 million) in July of 2007 at three potential maximum lake depths: 1 m, 10 m, and 50 m. For chlorophyll-a maps, area colors represent concentrations binned by 2017 NLA trophic state benchmarks. For TN and TP maps, area colors represent concentrations binned by 25th, 50th, and 75th percentiles of combined catchment predictions for July 2007.
Figure 5.
Figure 5.
Maps of the conterminous U.S. showing predictions of chlorophyll-a for lakes (n = 112,021) in July of (a) 2007 and (b) 2012. Point colors represent chlorophyll-a concentrations binned by 2017 NLA trophic state benchmarks. Panel (c) shows counts of these trophic designations for July 2007 and July 2012 lake predictions.
Figure 6.
Figure 6.
Maps of the conterminous U.S. showing change in predictions of chlorophyll-a for lakes (n = 112,021) between (a) May and July and (b) July and October of 2007. Point colors indicate change in chlorophyll-a concentration relative to a 30 μg/L threshold which corresponds to a hypereutrophic trophic state according to 2017 NLA benchmarks.

Similar articles

Cited by

References

    1. Adams H, Ye J, Persaud B, Slowinski S, Kheyrollah Pour H, & Van Cappellen P (2021). Chlorophyll-a growth rates and related environmental variables in global temperate and cold-temperate lakes. Earth System Science Data, 14(11), 5139–5156. 10.5194/essd-14-5139-2022 - DOI
    1. Beaver JR, Tausz CE, Scotese KC, Pollard AI, & Mitchell RM (2018). Environmental factors influencing the quantitative distribution of microcystin and common potentially toxigenic cyanobacteria in US lakes and reservoirs. Harmful Algae, 78, 118–128. 10.1016/j.hal.2018.08.004 - DOI - PMC - PubMed
    1. Bonilla S, Aguilera A, Aubriot L, Huszar V, Almanza V, Haakonsson S, et al. (2023). Nutrients and not temperature are the key drivers for cyanobacterial biomass in the Americas. Harmful Algae, 121, 102367. 10.1016/j.hal.2022.102367 - DOI - PubMed
    1. Brehob MM, Pennino MJ, Handler AM, Compton JE, Lee SS, & Sabo RD (2024). Estimates of lake nitrogen, phosphorus, and chlorophyll-a concentrations to characterize harmful algal bloom risk across the United States. [Dataset]. U.S. EPA Office of Research and Development (ORD). 10.23719/1529835 - DOI - PMC - PubMed
    1. Breiman L (2001). Random forests. Machine Learning, 45(1), 5–32. 10.1023/a:1010933404324 - DOI

LinkOut - more resources