

Decadal Shift in Nitrogen Inputs and Fluxes Across the Contiguous United States: 2002-2012
- PMID: 40547514
- PMCID: PMC12180915
- DOI: 10.1029/2019JG005110
Decadal Shift in Nitrogen Inputs and Fluxes Across the Contiguous United States: 2002-2012
Abstract
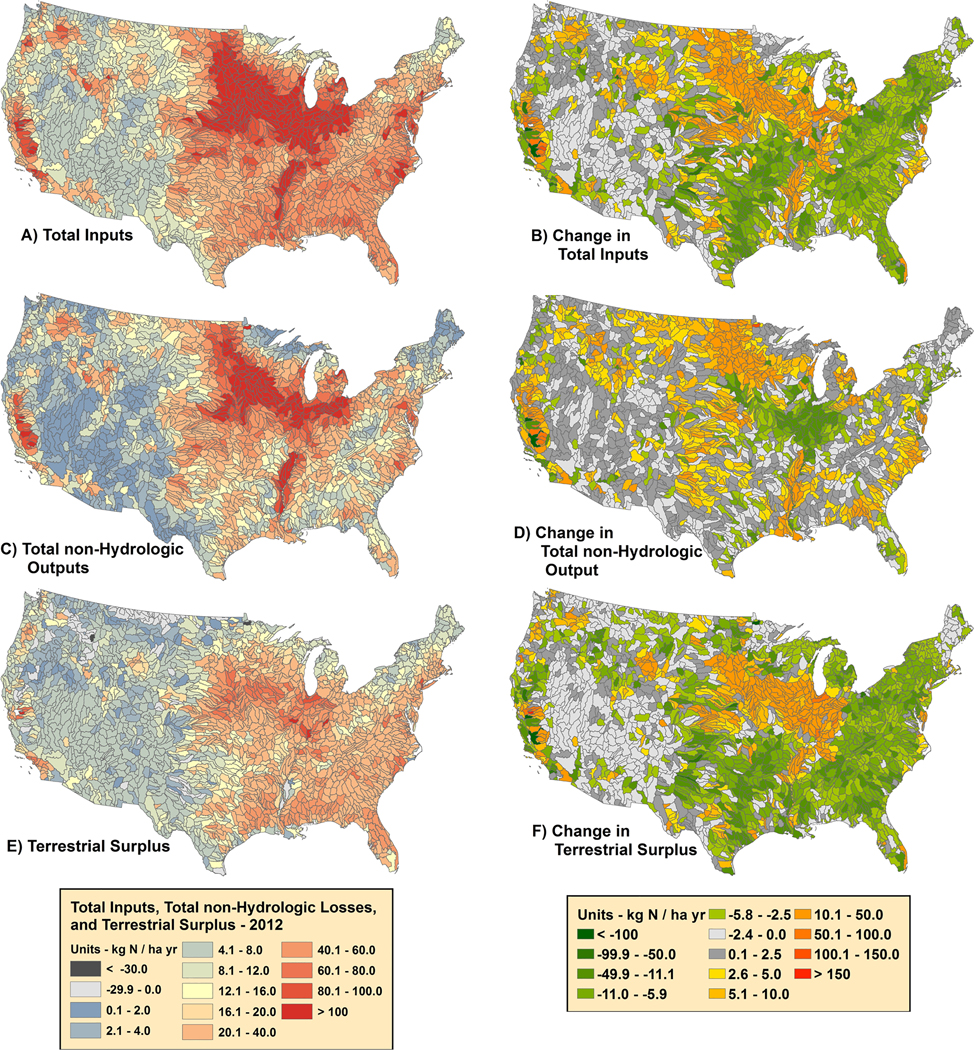
The effectiveness of policies and management actions in reducing the release of excess nitrogen (N) to the environment is best assessed if N fluxes across air, land, and water are regularly quantified at relevant scales. Here we compiled 2002, 2007, and 2012 inventories of inputs and nonhydrologic N outputs along with fossil fuel emissions, food demand, and terrestrial N surpluses for all subbasins of the contiguous United States using peer-reviewed, publicly available data sets. We found that at the national scale, total inputs, outputs, and surpluses changed little (±6%) between 2002 and 2012 and remained dominated by agricultural processes, despite efforts to curb N losses. This consistency at the national scale, however, obscured large counteracting shifts at regional levels driven by variable fluxes across regions. Throughout the eastern United States, declines in deposition and fertilizer inputs combined with increased crop yields resulted in a decrease in terrestrial N surpluses, which may explain recent water quality improvements in the region. On the other hand, fertilizer N inputs in the Midwest increased at a greater rate than crop harvest N increased, leading to a larger terrestrial surplus N. A large relative increase (~320%) in N emissions in the West due to an unusual wildfire season in 2012 was also observed. These changes coincided with national policies that decreased N emissions and increased demand for domestic biofuels, potentially highlighting the capacity to change the source and magnitude of N inputs and fluxes across the landscape through market and regulatory actions.
Figures


Similar articles
-
A rapid and systematic review of the clinical effectiveness and cost-effectiveness of paclitaxel, docetaxel, gemcitabine and vinorelbine in non-small-cell lung cancer.Health Technol Assess. 2001;5(32):1-195. doi: 10.3310/hta5320. Health Technol Assess. 2001. PMID: 12065068
-
Systemic pharmacological treatments for chronic plaque psoriasis: a network meta-analysis.Cochrane Database Syst Rev. 2021 Apr 19;4(4):CD011535. doi: 10.1002/14651858.CD011535.pub4. Cochrane Database Syst Rev. 2021. Update in: Cochrane Database Syst Rev. 2022 May 23;5:CD011535. doi: 10.1002/14651858.CD011535.pub5. PMID: 33871055 Free PMC article. Updated.
-
Sertindole for schizophrenia.Cochrane Database Syst Rev. 2005 Jul 20;2005(3):CD001715. doi: 10.1002/14651858.CD001715.pub2. Cochrane Database Syst Rev. 2005. PMID: 16034864 Free PMC article.
-
Systemic pharmacological treatments for chronic plaque psoriasis: a network meta-analysis.Cochrane Database Syst Rev. 2017 Dec 22;12(12):CD011535. doi: 10.1002/14651858.CD011535.pub2. Cochrane Database Syst Rev. 2017. Update in: Cochrane Database Syst Rev. 2020 Jan 9;1:CD011535. doi: 10.1002/14651858.CD011535.pub3. PMID: 29271481 Free PMC article. Updated.
-
Maternal and neonatal outcomes of elective induction of labor.Evid Rep Technol Assess (Full Rep). 2009 Mar;(176):1-257. Evid Rep Technol Assess (Full Rep). 2009. PMID: 19408970 Free PMC article.
Cited by
-
Designing a nitrogen-efficient cold-tolerant maize for modern agricultural systems.Plant Cell. 2025 Jul 1;37(7):koaf139. doi: 10.1093/plcell/koaf139. Plant Cell. 2025. PMID: 40673831 Free PMC article. Review.
-
Estimates of Lake Nitrogen, Phosphorus, and Chlorophyll-a Concentrations to Characterize Harmful Algal Bloom Risk Across the United States.Earths Future. 2024 Aug 26;12(8):e2024EF004493. doi: 10.1029/2024EF004493. Earths Future. 2024. PMID: 40547346 Free PMC article.
References
-
- Allen D, Pickering K, Pinder R, Henderson B, Appel K, & Prados A. (2012). Impact of lightning-NO on eastern United States photochemistry during the summer of 2006 as determined using the CMAQ model. Atmospheric Chemistry and Physics, 12(4), 1737–1758.
-
- Bentley J, & Linda K. (2017). Food availability (per capita) data system, edited by U. S. D. o. A. E. R. Service. https://www.ers.usda.gov/data-products/food-availability-per-capita-data...
-
- Bettez ND, Duncan JM, Groffman PM, Band LE, O’Neil-Dunne J, Kaushal SS, et al. (2015). Climate variation overwhelms efforts to reduce nitrogen delivery to coastal waters. Ecosystems, 18(8), 1319–1331.
-
- Bowman DM, Williamson GJ, Abatzoglou JT, Kolden CA, Cochrane MA, & Smith AM (2017). Human exposure and sensitivity to globally extreme wildfire events. Nature Ecology & Evolution, 1. - PubMed
Grants and funding
LinkOut - more resources
Full Text Sources
Medical