

Carbohydrate-Deficient Transferrin Evaluation Over Time Has Usefulness for Confirming Sobriety of Alcohol Rehabilitation Program Patients
- PMID: 40547817
- PMCID: PMC12179798
- DOI: 10.1002/jgh3.70185
Carbohydrate-Deficient Transferrin Evaluation Over Time Has Usefulness for Confirming Sobriety of Alcohol Rehabilitation Program Patients
Abstract
Background: For treating severe alcohol-related liver disease (ALD), abstinence from alcohol is essential. Because underreporting can occur, abstinence biomarkers are necessary during hepatology outpatient service. This study assesses whether serial changes of the serum carbohydrate-deficient transferrin to transferrin ratio (%CDT) reflect patient abstinence.
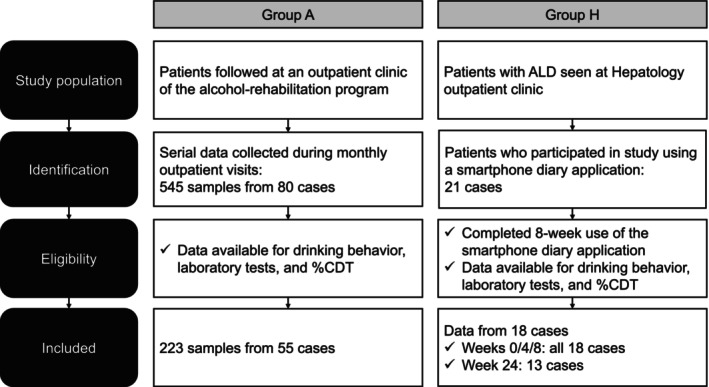
Methods: We retrospectively investigated serial %CDT measurements and laboratory data from two outpatient settings: patients in an alcohol rehabilitation program (A), and ALD patients at a hepatology clinic (H) who attempted abstinence with self-diary monitoring. Using group A data, correlation coefficients were determined between the number of days from the last drink (abstinence days) and laboratory data. Linear approximation was applied for significant coefficients. Using these results, %CDT was validated for group H.
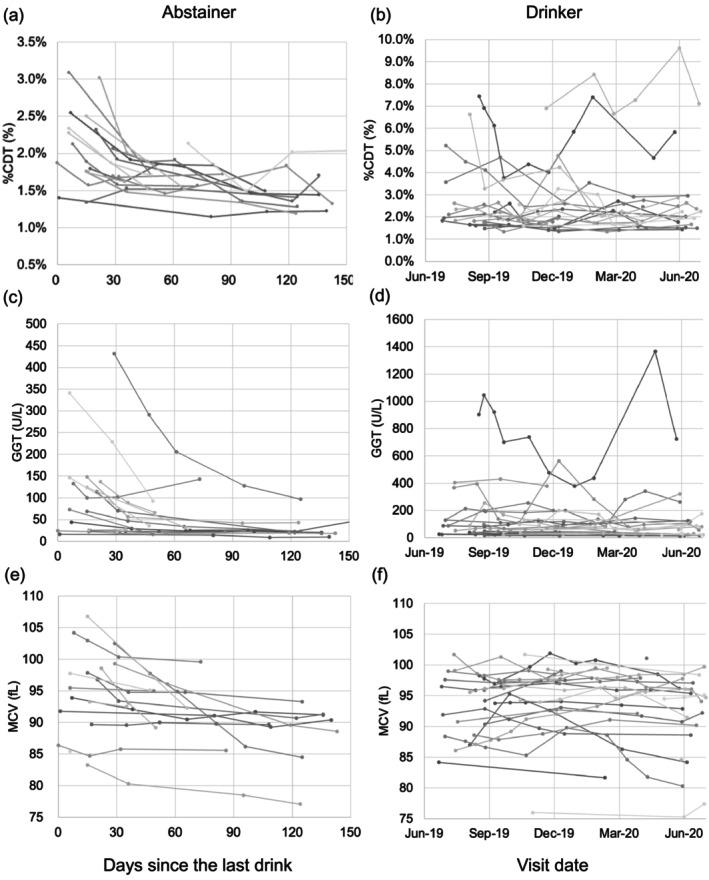
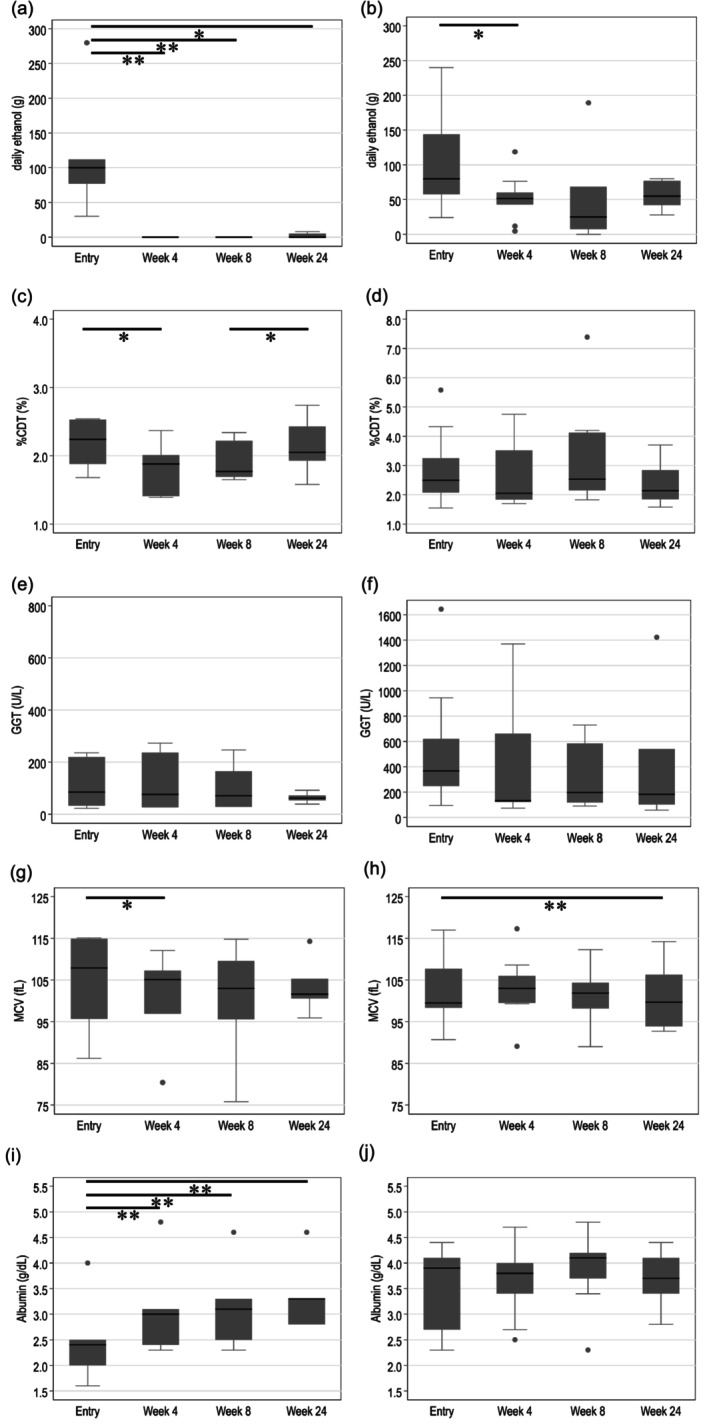
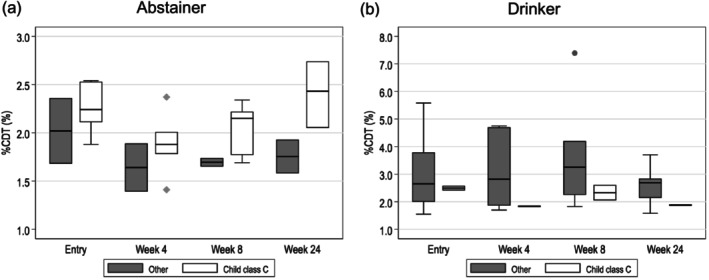
Results: Group A data were 223 data samples from 55 cases with abstinence days. Four (7%) were diagnosed as having cirrhosis. Eighteen patients continued abstinence over 30 days. %CDT (Rho = -0.50, p < 0.001) and GGT (Rho = -0.34, p < 0.01) were negatively correlated with abstinence days. For %CDT, negative linear approximation was maintained with the number of days (y = 2.01-0.004 x).Group H data were 18 cases, of which 12 (66%) were diagnosed as cirrhosis cases. Seven patients reported continued abstinence for 8 weeks, during which time %CDT values dropped significantly. The group H %CDT was higher than the group A %CDT, perhaps because of severer liver disease.
Conclusion: The %CDT trend assessment is useful to support continued, multi-month self-reported abstinence from alcohol, but it must be interpreted carefully in severe liver disorder cases.
Keywords: alcohol use disorder; ambulatory care; liver cirrhosis.
© 2025 The Author(s). JGH Open published by Journal of Gastroenterology and Hepatology Foundation and John Wiley & Sons Australia, Ltd.
Conflict of interest statement
The authors declare no conflicts of interest.
Figures

Similar articles
-
Signs and symptoms to determine if a patient presenting in primary care or hospital outpatient settings has COVID-19.Cochrane Database Syst Rev. 2022 May 20;5(5):CD013665. doi: 10.1002/14651858.CD013665.pub3. Cochrane Database Syst Rev. 2022. PMID: 35593186 Free PMC article.
-
Adefovir dipivoxil and pegylated interferon alfa-2a for the treatment of chronic hepatitis B: a systematic review and economic evaluation.Health Technol Assess. 2006 Aug;10(28):iii-iv, xi-xiv, 1-183. doi: 10.3310/hta10280. Health Technol Assess. 2006. PMID: 16904047
-
Heated tobacco products for smoking cessation and reducing smoking prevalence.Cochrane Database Syst Rev. 2022 Jan 6;1(1):CD013790. doi: 10.1002/14651858.CD013790.pub2. Cochrane Database Syst Rev. 2022. PMID: 34988969 Free PMC article.
-
Systemic pharmacological treatments for chronic plaque psoriasis: a network meta-analysis.Cochrane Database Syst Rev. 2021 Apr 19;4(4):CD011535. doi: 10.1002/14651858.CD011535.pub4. Cochrane Database Syst Rev. 2021. Update in: Cochrane Database Syst Rev. 2022 May 23;5:CD011535. doi: 10.1002/14651858.CD011535.pub5. PMID: 33871055 Free PMC article. Updated.
-
A rapid and systematic review of the clinical effectiveness and cost-effectiveness of paclitaxel, docetaxel, gemcitabine and vinorelbine in non-small-cell lung cancer.Health Technol Assess. 2001;5(32):1-195. doi: 10.3310/hta5320. Health Technol Assess. 2001. PMID: 12065068
References
-
- Umeshita K., Eguchi S., Egawa H., et al., “Liver Transplantation in Japan: Registry by the Japanese Liver Transplantation Society,” Hepatology Research 49, no. 9 (2019): 964–980. - PubMed
-
- Younossi Z. M., Wong G., Anstee Q. M., and Henry L., “The Global Burden of Liver Disease,” Clinical Gastroenterology and Hepatology 21, no. 8 (2023): 1978–1991. - PubMed
LinkOut - more resources
Full Text Sources
Miscellaneous
