. 2025 May 27;10(4):1055-1092.
doi: 10.1016/j.idm.2025.05.001. eCollection 2025 Dec.

Modeling the impact of hospitalization-induced behavioral changes on the spread of COVID-19 in New York City

Affiliations

Modeling the impact of hospitalization-induced behavioral changes on the spread of COVID-19 in New York City

Alice Oveson et al. Infect Dis Model. .

Abstract

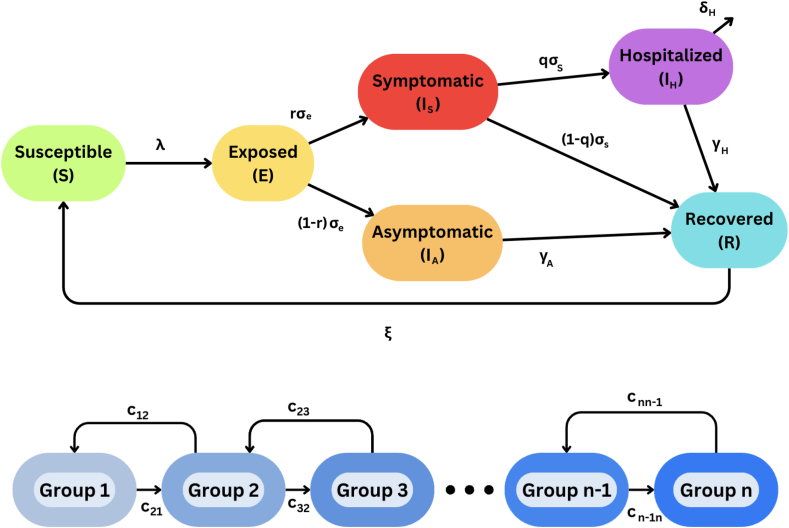
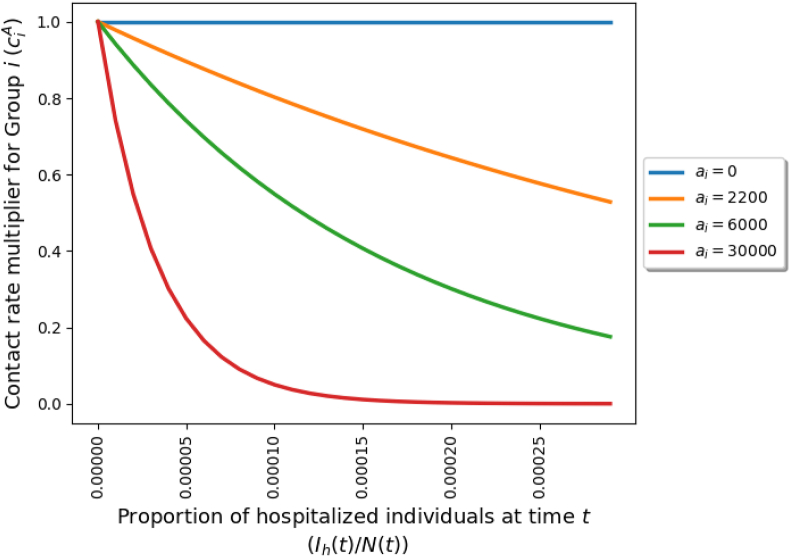
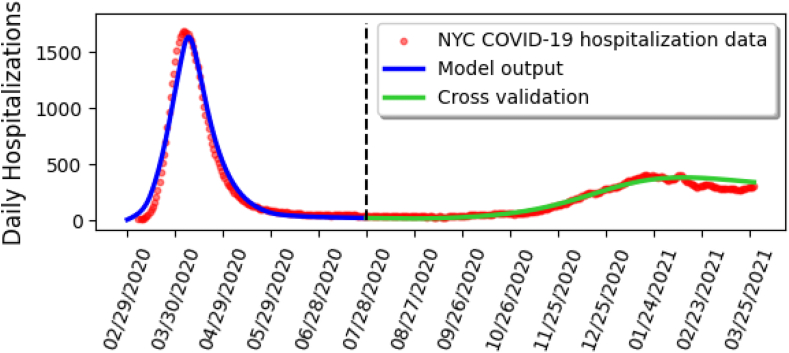
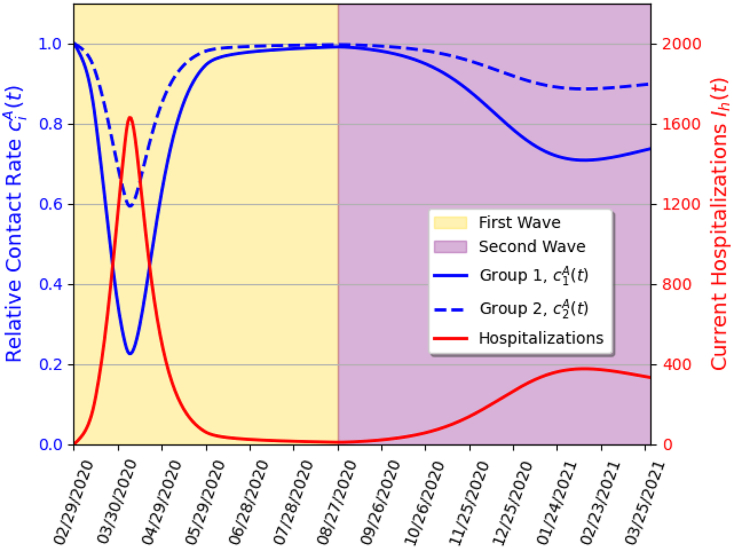
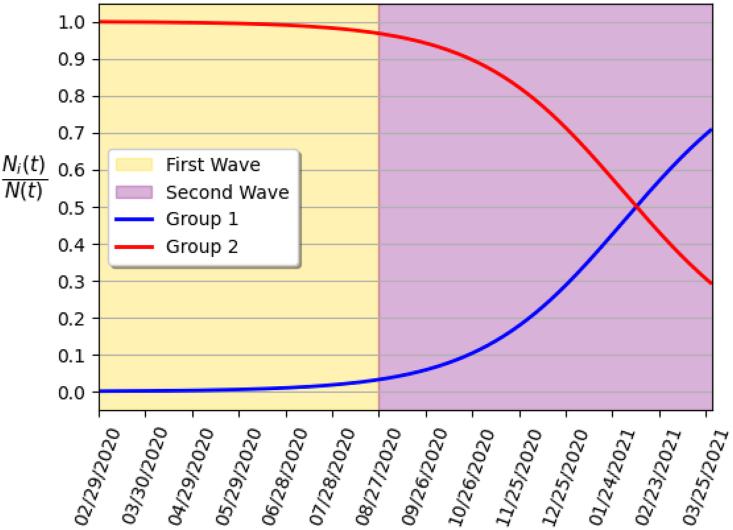
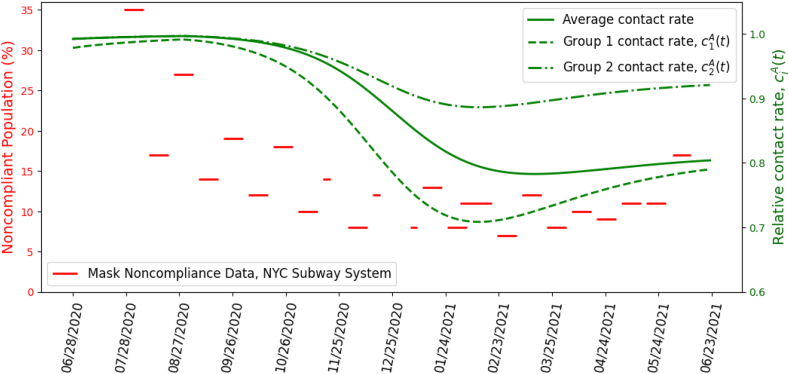
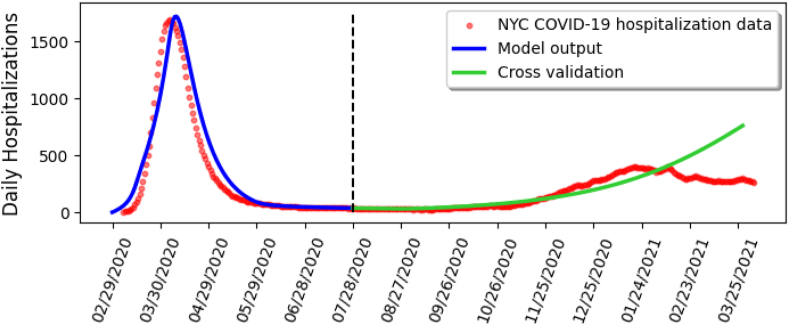
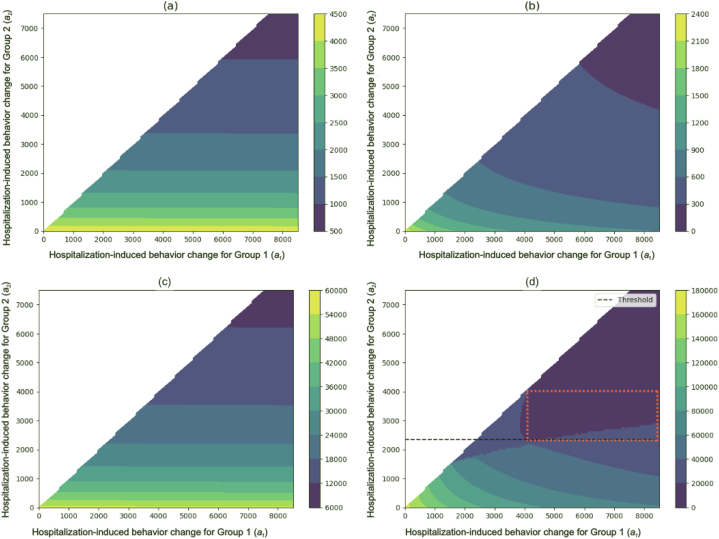
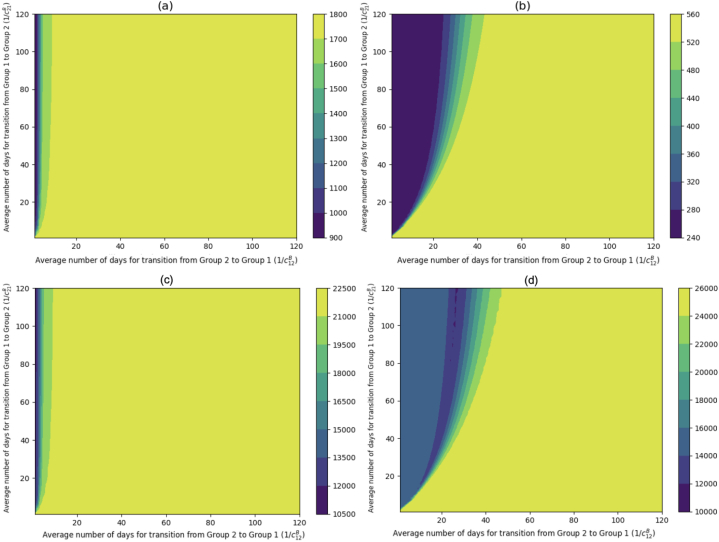
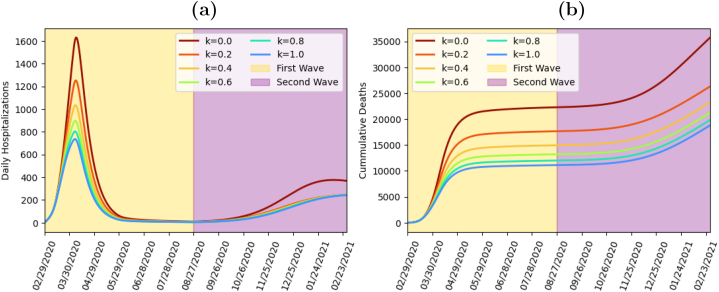
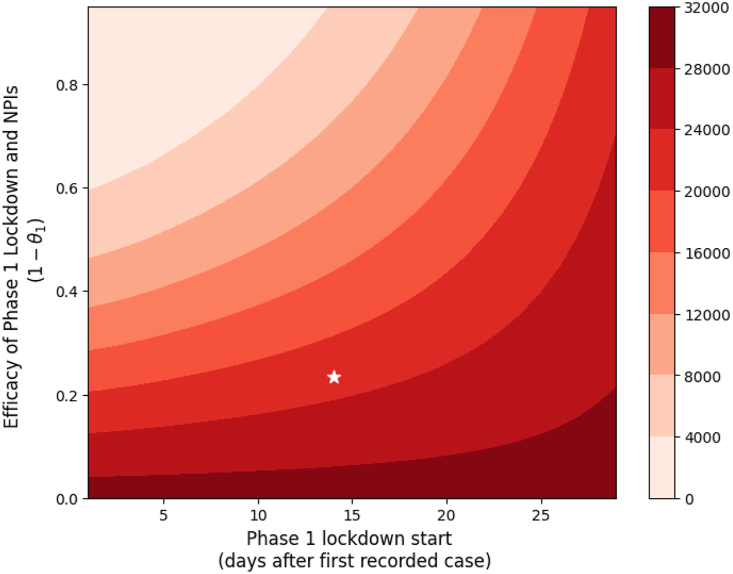
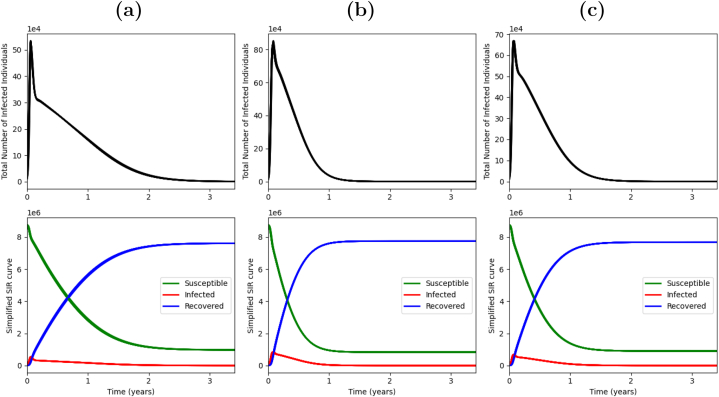
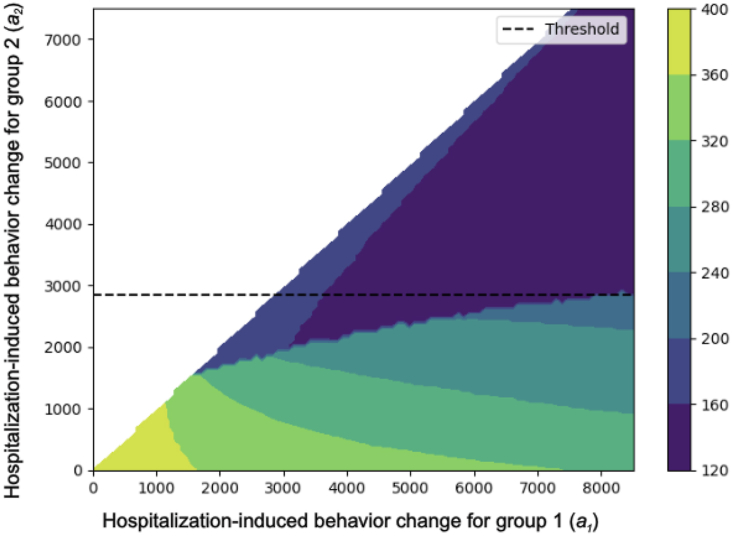
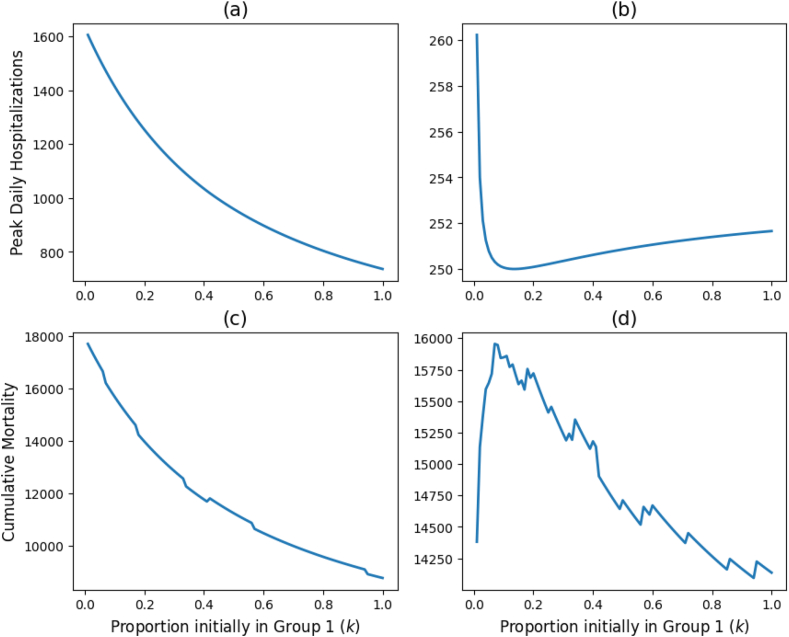
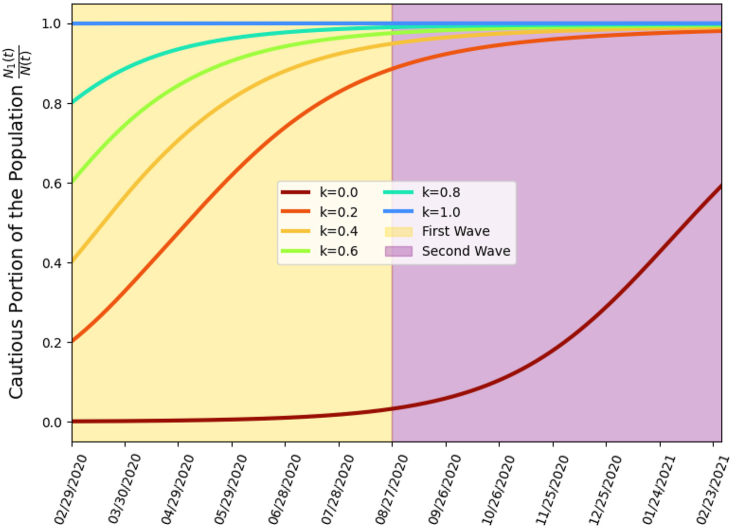
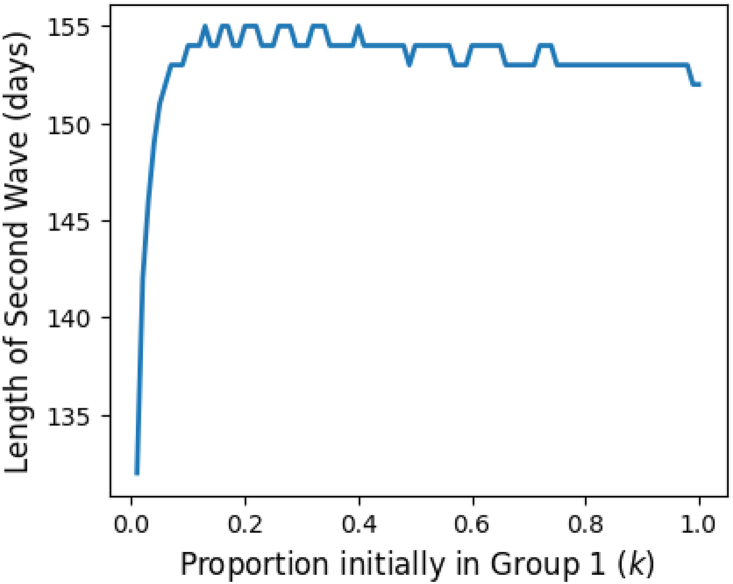
The COVID-19 pandemic, caused by SARS-CoV-2, highlighted heterogeneities in human behavior and attitudes of individuals with respect to adherence or lack thereof to public health-mandated intervention and mitigation measures. This study is based on using mathematical modeling approaches, backed by data analytics and computation, to theoretically assess the impact of human behavioral changes on the trajectory, burden, and control of the COVID-19 pandemic during the first two waves in New York City. A novel behavior-epidemiology model, which considers n heterogeneous behavioral groups based on level of risk tolerance and distinguishes behavioral changes by social and disease-related motivations (such as peer-influence and fear of disease-related hospitalizations), is developed. In addition to rigorously analyzing the basic qualitative features of this model, a special case is considered where the total population is stratified into two groups: risk-averse (Group 1) and risk-tolerant (Group 2). The 2-group model was calibrated and validated using daily hospitalization data for New York City during the first wave, and the calibrated model was used to predict the data for the second wave. The 2-group model predicts the daily hospitalizations during the second wave almost perfectly, compared to the version without behavioral considerations, which fails to accurately predict the second wave. This suggests that epidemic models of the COVID-19 pandemic that do not explicitly account for heterogeneities in human behavior may fail to accurately predict the trajectory and burden of the pandemic in a population. Numerical simulations of the calibrated 2-group behavior model showed that while the dynamics of the COVID-19 pandemic during the first wave was largely influenced by the behavior of the risk-tolerant (Group 2) individuals, the dynamics during the second wave was influenced by the behavior of individuals in both groups. It was also shown that disease-motivated behavioral changes (i.e., behavior changes due to the level of COVID-19 hospitalizations in the community) had greater influence in significantly reducing COVID-19 morbidity and mortality than behavior changes due to the level of peer or social influence or pressure. Finally, it is shown that the initial proportion of members in the community that are risk-averse (i.e., the proportion of individuals in Group 1 at the beginning of the pandemic) and the early and effective implementation of non-pharmaceutical interventions have major impacts in reducing the size and burden of the pandemic (particularly the total COVID-19 mortality in New York City during the second wave).

Keywords: Behavioral-epidemiology model; COVID-19; Equilibria; Influence dynamics.


Conflict of interest statement

The author is an Editorial Board Member/Editor-in-Chief/Associate Editor/Guest Editor for Infectious Disease Modelling and was not involved in the editorial review or the decision to publish this article.

Figures

Fig. 1
Fig. 1
Flow diagram of the heterogeneous n-group behavior model (2.1), illustrating the disease dynamics (top panel) and the influence dynamics with n behavioral groups (bottom panel).
Fig. 2
Fig. 2
Profile of the effective contact rate modification parameter (ciA(t)), as a function of the proportion of the hospitalized population (Ih(t)/N(t)), for various values of ai (the modification parameter for the hospitalization-induced behavior change by individuals in Group i).
Fig. 3
Fig. 3
Simulations of the 2-group behavior model (A.1), showing the profile of the total number of infected individuals (top) and the total number of individuals in the community, stratified by behavioral group (N1(t) and N2(t))(bottom), as a function of time for various initial conditions. Column (a): c12B=0.5,c21B=0.25 (Γ = 2 > 1). Column (b): c12B=0.25,c21B=0.5 (Γ = 0.5 < 1). Column (c): c12B=c21B=0.5 (Γ = 1). In all panels, all other parameter values used in these simulations are as given in Table 3, Table 4, but with θl = 1, βa = 0.1, and βi = 0.05 (so that, Rc=0.78<1). These simulations show that when Rc<1, solutions of model (A.1) converge to G1DFE if Γ > 1 (see Figure(a)), G2DFE if Γ < 1 (see Figure(b)), and G3DFE if Γ = 1 (see Figure(c)), in line with Theorem 3.4, Theorem 3.5, Theorem 3.6.
Fig. 4
Fig. 4
Simulations of the 2-group behavior model (A.1), showing the profile of the total number of infected individuals (top) and the total number of individuals in the community, stratified by behavioral group (N1(t) and N2(t))(bottom), as a function of time for various initial conditions. Column (a): c12B=0.5,c21B=0.25 (Γ = 2 > 1). Column (b): c12B=0.25,c21B=0.5 (Γ = 0.5 < 1). Column (c): c12B=c21B=0.5 (Γ = 1). All other parameter values used in these simulations are as given in Table 3, Table 4, but with θl = 1, βa = 1, and βi = 0.5 (so that, Rc=7.8>1). These simulations show that when Rc>1, solutions of the 2-group model (A.1) converge to the extinction equilibrium (TDFE), regardless of the value of Γ.
Fig. 5
Fig. 5
Stability regions of different disease-free equilibria of the 2-group behavior model (A.1), as determined by the values of the control reproduction number Rc and the relative influence ratio Γ. This figure shows that the 2-group behavior model (A.1) has a bifurcation at Rc=1 and a separatrix at Γ = 1.
Fig. 6
Fig. 6
Data fitting and cross validation of the 2-group behavior model (A.1), using the 7-day running average daily hospitalization data for New York City (NYC Health, 2023) (red dots), carried out using the BFGS algorithm. The values of the fixed parameters of the 2-group model, used in fitting it with the data, are given in Table 3, and the values of the estimated parameters of the 2-group model (obtained from the data fitting), together with their associated 95 % confidence intervals, are given in Table 4. The data fitting (blue curve) is carried out using the data from the first 150 days after the index case in New York City (i.e., from February 29, 2020 to July 28, 2020), while the cross-validation (green curve) is carried out using the following eight months worth of data (i.e., from July 29, 2020 to March 25, 2021). The eight unknown parameters of the 2-group model were estimated from the data fitting to the model, and their estimated values are tabulated in Table 4.
Fig. 7
Fig. 7
Profile of the relative contact rates (ciA(t) for i = 1, 2) as compared with the number of hospitalized individuals over time (Ih(t)). This figure is generated by solving the 2-group behavior model (A.1), using the fixed and estimated parameters given in Table 3, Table 4, respectively (to obtain the value of Ih(t) for each t), together with the estimated values of the parameters a1 and a2 (given in Table 4) to compute the relative contact rate multipliers for individuals in Group 1 (c1A(t), solid blue curve) and Group 2 (c2A(t), dashed blue curve) over time. The number of individuals who are currently hospitalized (Ih(t)) is depicted by the red curve. The time periods of the first and second waves are represented by the shaded yellow and purple regions, respectively.
Fig. 8
Fig. 8
Profile of the relative group sizes (Ni(t)/N(t) for i = 1, 2) over time. This figure is generated by solving the 2-group behavior model (A.1), using the fixed and estimated parameters given in Table 3, Table 4, respectively (to obtain the values of N1(t) and N2(t) for each t) to compute the population dynamics for Group 1 (N1(t)N(t), blue curve) and Group 2 (N2(t)N(t), red curve) over time. The time periods of the first and second waves are represented by the shaded yellow and purple regions, respectively.
Fig. 9
Fig. 9
Profile of the contact rates (c1A(t) and for c2A(t)) of individuals in the two behavioral groups, as a function of time, during the first two waves of the COVID-19 pandemic, superimposed on data for mask noncompliance on the New York City subway system (MTA subway and bus mask, 2024). Parameter values used in the simulations are as given in Table 3, Table 4 The purple curve represents the relative contact rate of individuals in the risk-taking group (Group 2, c2A(t)); the gold curve represents the relative contact rate of individuals in the cautious group (Group 1, c1A(t)); and the green curve represents the population average relative contact rate (N1(t)N(t)c1A(t)+N2(t)N(t)c2A(t)). The profiles are compared with empirical data for mask non-compliance in New York City during the same period (shown in red dashed lines, with each dash corresponding to the data collection period).
Fig. 10
Fig. 10
Data fitting and cross validation of the behavior-free model (A.2), using the 7-day running average daily hospitalization data for New York City (red dots) (NYC Health, 2023), carried out using the BFGS algorithm. The values of the fixed parameters of the behavior-free model, used in fitting it to the data, are given in Table 3, and the values of the estimated parameters of the model (obtained from the fitting) are given in Table 6. The fitting (blue curve) is carried out using the data for the first 150 days after the index case in New York City (i.e., from February 29, 2020 to July 28, 2020), while the cross-validation (green curve) is carried out using the subsequent eight months worth of data (i.e., from July 29, 2020 to March 25, 2021). The four unknown parameters of the behavior-free model (θl,1, θl,2, θl,3, θl,4) were estimated from fitting the model with the data, and their estimated values are tabulated in Table 6.
Fig. 11
Fig. 11
Partial Rank Correlation Coefficient (PRCC) values for the 18 parameters of the model (A.1) with respect to peak daily hospitalizations at (a) April 2020 and (b) February 2021 using parameter intervals as given in Table 9. Exact PRCC values are given in Table 10(a) in the Appendix.
Fig. 12
Fig. 12
Partial Rank Correlation Coefficient (PRCC) values for the 18 parameters of the model (A.1) with respect to cumulative mortality at (a) April 2020 and (b) February 2021 using parameter intervals as given in Table 9. Exact PRCC values are given in Table 10(b) in the Appendix.
Fig. 13
Fig. 13
Effect of the hospitalizations-induced behavior change parameters, a1 and a2, on the peak daily hospitalizations and cumulative mortality in New York City during the first two waves of the COVID-19 pandemic. Simulations of the behavior model (A.1) with the baseline parameter values in Table 3, Table 4, and various values of a1 and a2. (a) Effect of a1 and a2 on the peak daily hospitalizations during the first wave. (b) Effect of a1 and a2 on the peak daily hospitalizations during the second wave. (c) Effect of a1 and a2 on the cumulative mortality during the first wave. (d) Effect of a1 and a2 on the cumulative mortality during the second wave. The black line labeled “threshold” indicates a value of a2 above which a significant reduction in the cumulative mortality can be achieved. The dotted red box highlights a region in the a1-a2 plane within which an increase in a1 leads to an increase in the cumulative COVID-19 mortality.
Fig. 14
Fig. 14
Effect of the peer influence-induced behavior change parameters, c12B and c21B, on the peak daily hospitalizations and cumulative mortality in New York City during the first two waves of the COVID-19 pandemic. Simulations of the 2-group behavior model (A.1) with the baseline parameter values in Table 3, Table 4, and various values of c12B and c21B. (a) Effect of c12B and c21B on the peak daily hospitalizations during the first wave. (b) Effect of c12B and c21B on the peak daily hospitalizations during the second wave. (c) Effect of c12B and c21B on the cumulative mortality during the first wave. (d) Effect of c12B and c21B on the cumulative mortality during the second wave.
Fig. 15
Fig. 15
Effect of initial sizes of the two behavioral groups on daily hospitalizations (Ih(t)) and cumulative mortality during the first two waves of the COVID-19 pandemic in New York City. Simulations of the 2-group behavior model (A.1) using the parameter values in Table 3, Table 4 and various initial sizes of the behavioral groups (S1(0) = kN(0) and S2(0) = (1 − k)N(0), for k = 0, 0.2, 0.4, …, 1). (a) Daily COVID-19 hospitalizations, as a function of time during the first two waves (Ih(t)). (b) Cumulative COVID-19 mortality, as a function of time during the first two waves in New York City.
Fig. 16
Fig. 16
Heat map assessing the effect of early implementation vs. efficacy of lockdown and other NPI measures (1 − θl,1) on the cumulative mortality during the first wave of the COVID-19 pandemic in New York City. Simulations of the 2-group behavior model (A.1) with the baseline values of the fixed and estimated parameters of the model given in Table 3, Table 4, respectively, and various values of θl,1 and start dates for the implementation of the Phase 1 lockdown and other NPI measures after the index case of the COVID-19 pandemic in New York City. The white star marks the coordinates of the fitted value of θl,1 = 0.74664 (estimated in Section 3.2.2) and the reported start date of lockdown in New York City (=14 days (Ferré-Sadurní, 2020)).
Fig. C.1
Fig. C.1
Simulations of the 2-group model (A.1), showing the profile of the total number of infected individuals (top) and the total number of individuals in the community, stratified by disease state (susceptible, infected, recovered), as a function of time for various initial conditions. Column (a): c12B=0.5,c21B=0.25 (Γ = 2 > 1). Column (b): c12B=0.25,c21B=0.5 (Γ = 0.5 < 1). Column (c): c12B=c21B=0.5 (Γ = 1). In all panels all other parameter values used in these simulations are as given in Table 3, Table 4, but with θl = 1, βa = 1, βi = 0.5, and ξ = 0 (so that, Rc=7.8>1 and infection does not induce permanent immunity). These simulations show that when Rc>1 and infection does not induce permanent immunity, solutions of the 2-group model (A.1) satisfy the Kermack-Mckendrick constraint S() − S(0) > 0 (Gumel, Iboi, Ngonghala, & Elbasha, 2021), regardless of the value of Γ.
Fig. C.2
Fig. C.2
Effect of the hospitalization-motivated behavioral modifiers, a1 and a2, on the length (in days) of the second wave of the COVID-19 pandemic in New York City. Simulations of the model (A.1) with the baseline parameter values in Table 3, Table 4, and various values of a1 and a2. The end of the second wave was determined by the first day of the simulation after the start of the second wave wherein the total number of infected individuals (including exposed, asymptomatically infectious, symptomatically infectious, and hospitalized individuals) fell below 200.
Fig. C.3
Fig. C.3
Effect of initial sizes of the two behavioral groups on peak daily hospitalizations and cumulative mortality during the first two waves of the COVID-19 pandemic in New York City. Simulations of the behavior model (A.1) using the parameter values in Table 3, Table 4 and various initial sizes of the behavioral groups (S1(0) = kN(0) and S2(0) = (1 − k)N(0), for k = 0, 0.2, 0.4, …, 1). (a) First wave peak daily hospitalizations, as a function of initial Group 1 size (k). (b) Second wave peak daily hospitalizations, as a function of initial Group 1 size (k). (c) First wave cumulative mortality, as a function of initial Group 1 size (k). (d) Second wave cumulative mortality, as a function of initial Group 1 size (k).
Fig. C.4
Fig. C.4
Effect of initial sizes of the two behavioral groups on the relative size of Group 1 (N1(t)N(t)) during the first two waves of the COVID-19 pandemic in New York City. Simulations of the 2-group behavior model (A.1) using the parameter values in Table 3, Table 4 and various initial sizes of the behavioral groups (S1(0) = kN(0) and S2(0) = (1 − k)N(0), for k = 0, 0.2, 0.4, …, 1).
Fig. C.5
Fig. C.5
Effect of initial sizes of the behavioral groups on the length (in days) of the second wave of the COVID-19 pandemic in New York City. Simulations of the model (A.1) with the baseline parameter values in Table 3, Table 4 and various initial sizes of behavioral groups (S1(0) = kN(0) and S2(0) = (1 − k)N(0) for 0 ≤ k ≤ 1). The end of the second wave was determined by the first day of the simulation after the start of the second wave wherein the total number of infected individuals (including exposed, asymptomatically infectious, symptomatically infectious, and hospitalized individuals) fell below 200.

Similar articles

References

    1. Akaike H. A new look at the statistical model identification. IEEE Transactions on Automatic Control. 1974;19(6)
    1. Altman J.D., Miner D.S., Lee A.A., Asay A.E., Nielson B.U., et al. Factors affecting vaccine attitudes influenced by the COVID-19 pandemic. Vaccines. 2023;11(3) - PMC - PubMed
    1. Amid ongoing COVID-19 pandemic Governor Cuomo announces New York City playgrounds will close. 2020. https://www.governor.ny.gov/news/video-audio-rush-transcript-amid-ongoin... Available at:
    1. Amid ongoing COVID-19 pandemic, Governor Cuomo announces NYS on pause functions extended for additional two weeks. 2020. https://www.governor.ny.gov/news/amid-ongoing-covid-19-pandemic-governor... Available at:
    1. Anderson R.M., May R.M. Oxford University Press; 1992. Infectious diseases of humans: Dynamics and control.

LinkOut - more resources