. 2025 Jun 6:15:1554845.
doi: 10.3389/fonc.2025.1554845. eCollection 2025.

Interrogation of macrophage-related prognostic signatures reveals a potential immune-mediated therapy strategy by histone deacetylase inhibition in glioma

Affiliations

Interrogation of macrophage-related prognostic signatures reveals a potential immune-mediated therapy strategy by histone deacetylase inhibition in glioma

Xisen Wang et al. Front Oncol. .

Abstract

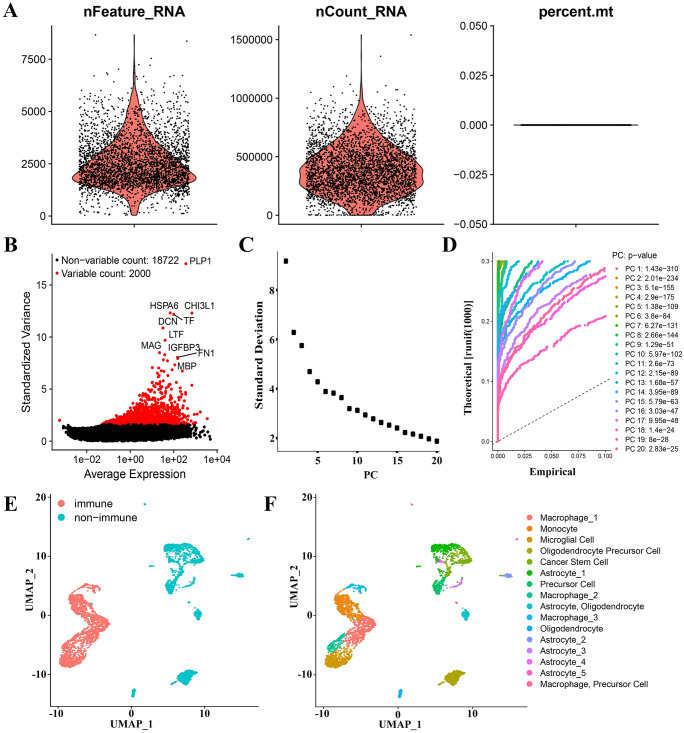
Background: Glioma-associated macrophages (GAMs) originate from intracranially resident microglia and myeloid-derived macrophages. In the glioma microenvironment, these two types of macrophages tend to adopt a specialized activation state known as type 2 or M2 macrophages and play crucial roles in the progression of glioma.

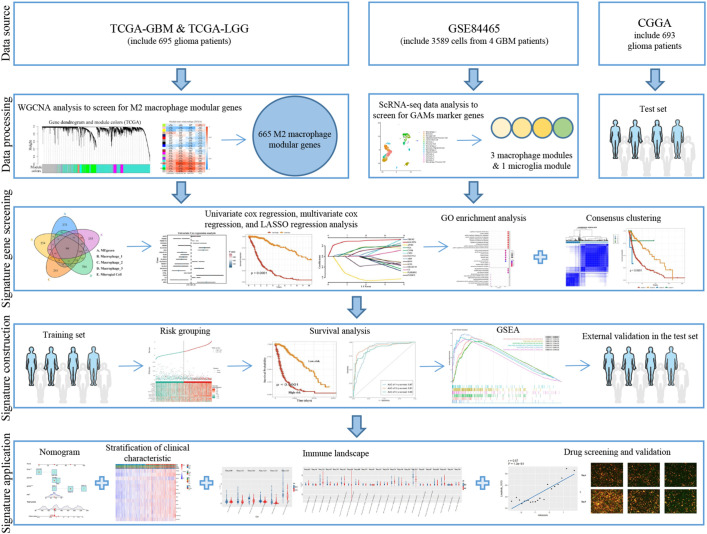
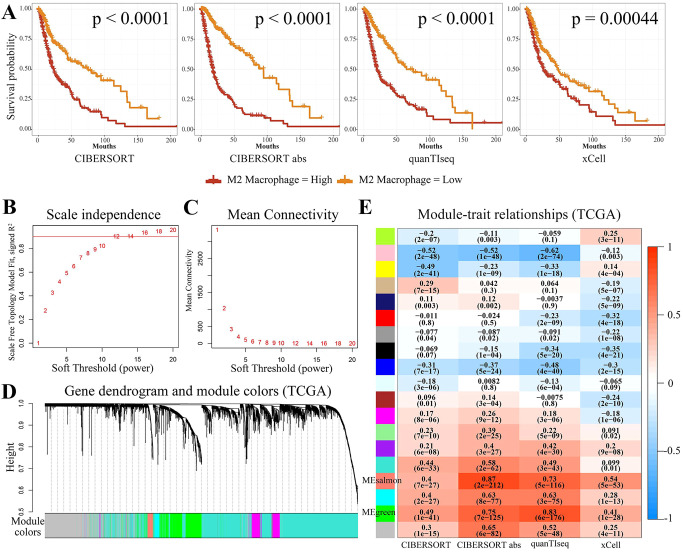
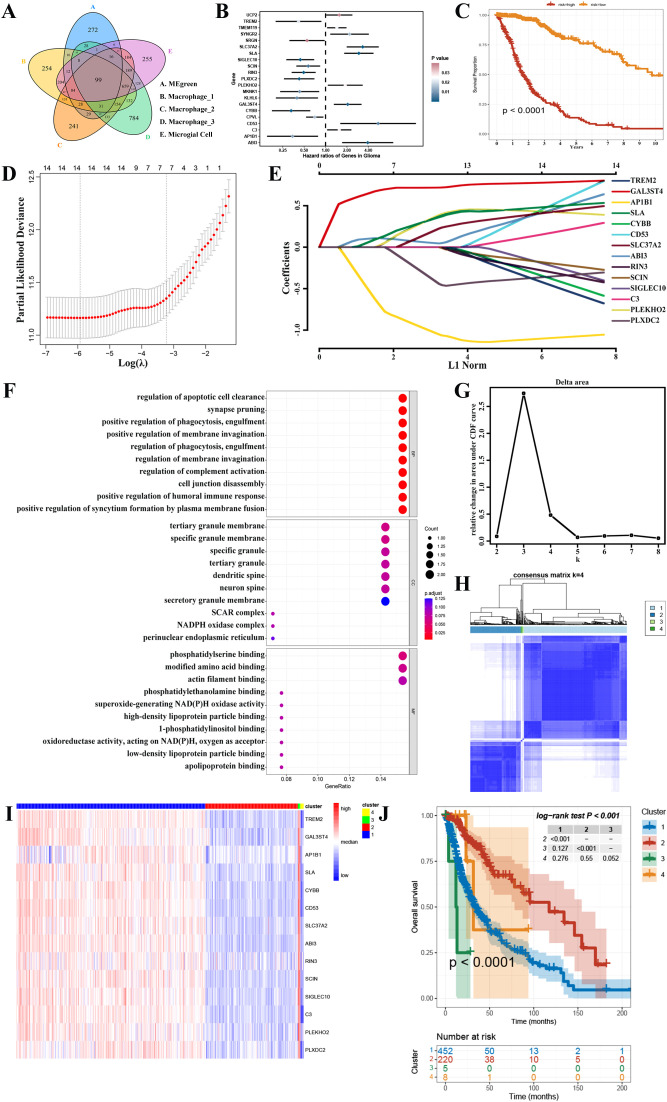
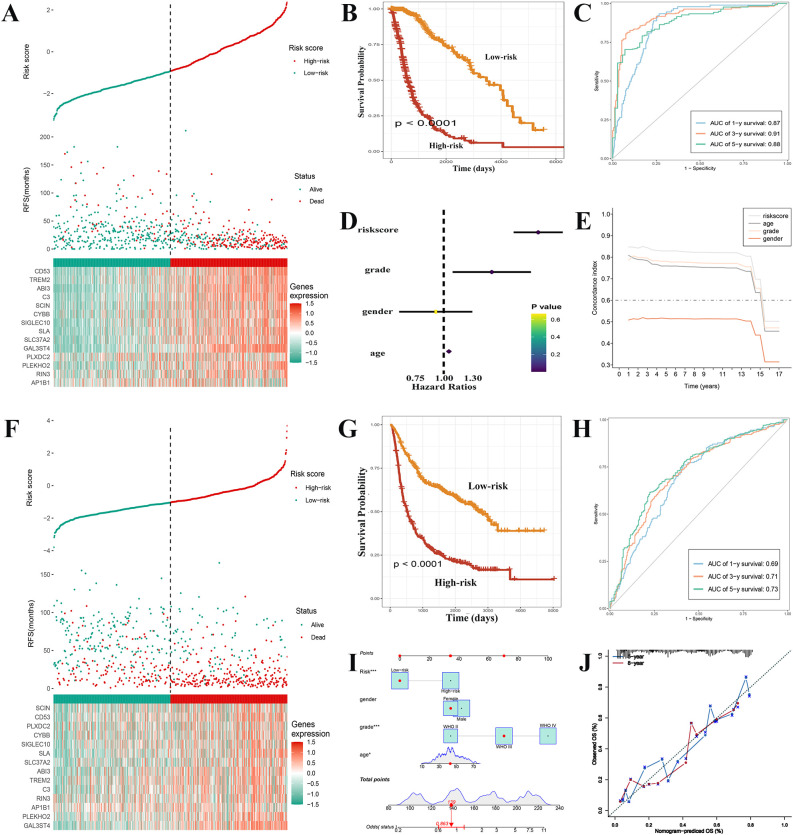
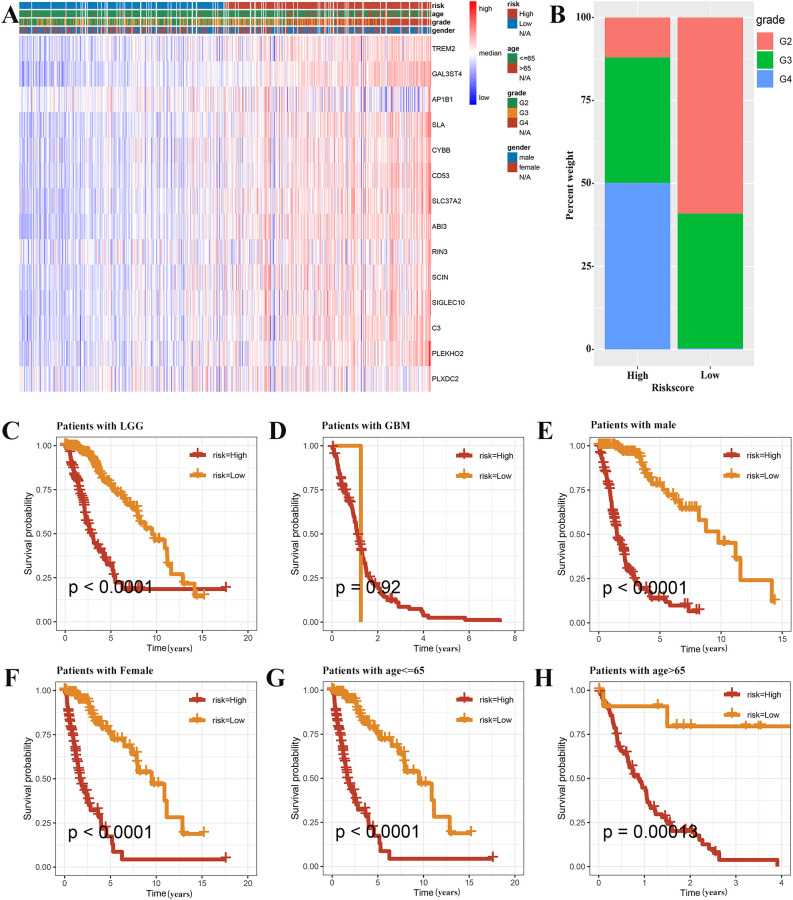
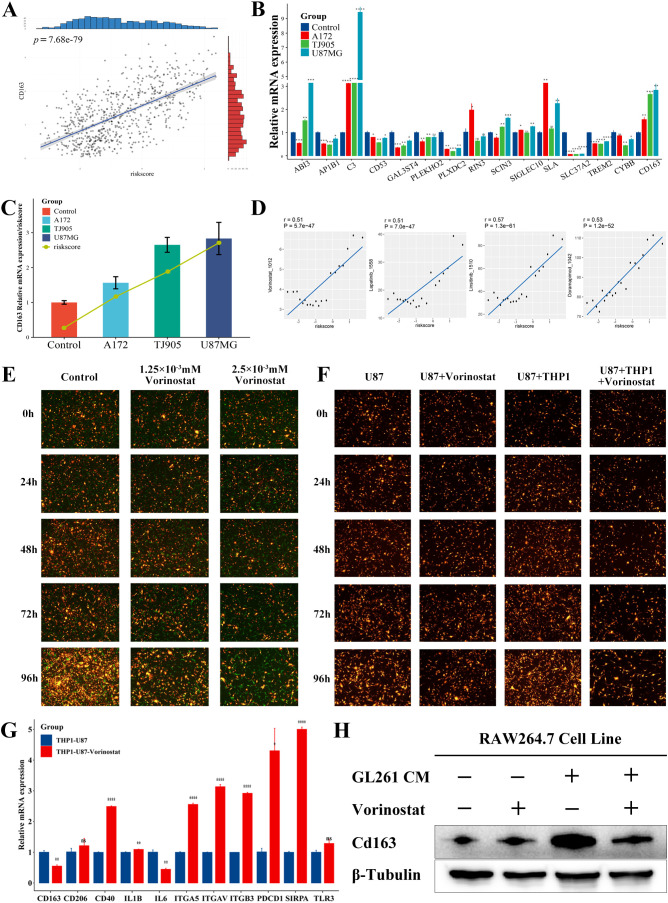
Methods: To identify genes associated with GAMs, we intersected genes identified from single-cell RNA sequencing (scRNA-seq) data (specific to GAMs) with M2 macrophage module genes derived from weighted gene coexpression network analysis (WGCNA). Prognostic genes were screened using univariate Cox regression, multivariate Cox regression, and least absolute shrinkage and selection operator (LASSO) regression analysis. These genes were used to construct and validate prognostic signatures and to delineate the immune landscape. During drug screening, Vorinostat exhibited the highest risk score and the lowest half-maximal inhibitory concentration (IC50). The expression of the 14 prognostic genes was further investigated using a glioma cell-macrophage co-culture model.

Results: Fourteen prognostic genes (TREM2, GAL3ST4, AP1B1, SLA, CYBB, CD53, SLC37A2, ABI3, RIN3, SCIN, SIGLEC10, C3, PLEKHO2, and PLXDC2) were identified. The prognostic model constructed from these genes demonstrated robust predictive efficacy. Based on this model, Vorinostat was prioritized as a candidate therapeutic agent, and subsequent validation confirmed its significant inhibitory effects on the glioma microenvironment.

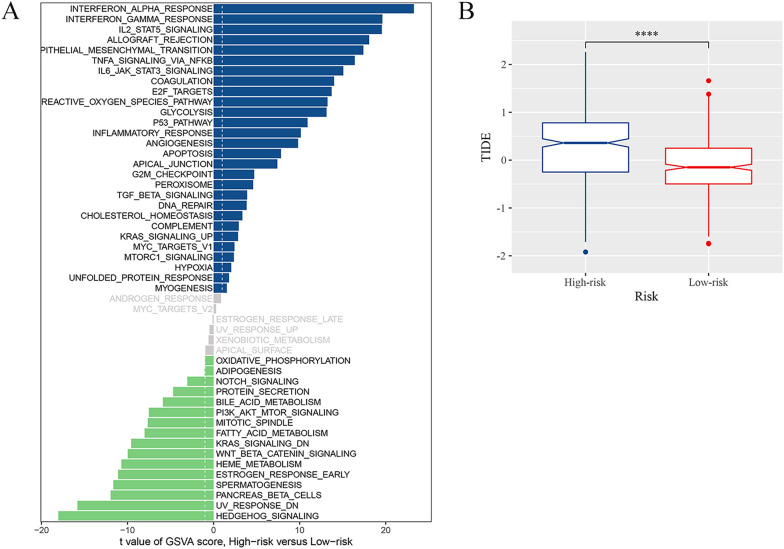
Conclusion: These findings elucidate the molecular mechanisms of GAMs in glioma, uncover the immunological landscape of the tumor microenvironment, and identify potential therapeutic targets and drug action mechanisms.

Keywords: glioma; glioma-associated macrophages; histone deacetylase inhibitors; immune microenvironment; prognostic signature; vorinostat.


Conflict of interest statement

The authors declare that the research was conducted in the absence of any commercial or financial relationships that could be construed as a potential conflict of interest.

Figures

Figure 1
Figure 1
Flowchart.
Figure 2
Figure 2
Screening for M2-associated genes in glioma using WGCNA. (A) Kaplan-Meier survival curves for the four immune infiltration algorithms, namely, CIBERSORT, CIBERSORT abs, quanTIseq, and xCell, for groups with high and low M2 macrophage concentration. (B, C) The WGCNA package’s specifications led to the choice of 12 as the soft threshold power. (D, E) There were 18 non-gray modules observed by correlation analysis of the defined modules. MEsalmon and MEgreen were the two modules found to be predominantly associated with M2 macrophages.
Figure 3
Figure 3
GAMs marker genes of GBM patients were derived through analysis of scRNA-seq data. (A) Data quality control of scRNA-seq from GBM cell samples. (B) The top 2000 differential genes have been shown in a scatter plot. (C, D) The cells were classified using PCA and the top 20 PCs are shown. (E) Cells were first classified into “non-immune” and “immune” using the UMAP algorithm. (F) Cells were annotated using “singleR” and “scCATCH” R packages.
Figure 4
Figure 4
Screening for GAMs-associated prognostic genes. (A) The candidate genes associated with GAMs. (B) The results of a univariate cox regression study identified 21 distinct genes associated with GAMs. (C) Multivariate cox regression analysis was used to construct a survival analysis for the risk stratification. (D, E) Signature genes were discovered using LASSO regression analysis. (F) GO database functional enrichment analysis. (G, H) Consensus clustering revealed that K=4 was the best, and TCGA-GBMLGG was divided into 4 clusters. (I) The heatmap depicted the variations in gene expression between the 4 clusters. (J) The Kaplan-Meier survival curve showed the discrepancies in the survival rates among the four clusters.
Figure 5
Figure 5
Construction of GAMs-related prognostic features and external validation. (A) Comparison of the survival status of glioma patients with different risk scores in the training set. (B) The high-risk group of training set exhibited a much poorer prognosis, according to Kaplan-Meier survival curves. (C) ROC curves with their AUCs for 1, 3, and 5 years, respectively. (D, E) In contrast to other indicators, the risk score was discovered to serve as an independent risk factor for the survival status using univariate analysis and the C-index. (F) Patients with gliomas in the high-risk and low-risk categories of the test set were compared for the survival status and risk score. (G) The high-risk group in the text set had a lower survival time, as indicated by the Kaplan-Meier survival curve. (H) ROC curves with their AUCs for 1, 3, and 5 years, respectively. (I) Nomogram based on the various clinical markers and risk scores. The results of a calibration curve (J) demonstrated the consistent reliable performance of the nomogram.
Figure 6
Figure 6
Prognostic analysis based on the clinicopathological categorization. (A) A heat map was employed to depict the variations in gene expression and clinicopathologic characteristics among the two risk groups. (B) The histogram revealed risk scores correlated with the various clinicopathological characteristics. The results of prognostic analysis stratified by the tumor grade (C, D), sex (E, F), and age (G, H) were presented using Kaplan-Meier survival analysis.
Figure 7
Figure 7
Immune landscape associated with the risk signatures. (A) Analysis of GSVA among the patients of two risk groups. (B) TIDE score for high-risk and low-risk groups (****p <0.0001).
Figure 8
Figure 8
Prediction and validation of the potential anticancer drugs. (A) Correlation between CD163 expression and risk score in the TCGA database (p <0.0001). (B) Differences in mRNA expression of various prognostic genes and CD163 in the indirect co-culture model (*p <0.05; * *p <0.01; * * *p <0.001; * * * *p <0.0001). (C) Expression of CD163 and risk score in the indirect co-culture model. (D) Potential anticancer drugs were predicted using signature genes and a risk score. (E) The U87MG (RP) was cocultured with the PMA-induced adherent THP1 (GP), and the treatment groups were then treated with Vorinostat. (F) Analysis of growth of U87MG and U87MG cocultured with PMA-induced adherent THP1 before and after Vorinostat treatment. (G) Expression of macrophage-related immune checkpoints of THP1 before and after the treatment with Vorinostat in the U87MG-THP1 indirect co-culture model (*p <0.05; * *p <0.01; * * *p <0.001; * * * *p <0.0001). (H) The expression of Cd163 in RAW264.7 cells at the protein level, with GL261 conditioned medium and Vorinostat as variables.

References

    1. Ostrom QT, Gittleman H, Truitt G, Boscia A, Kruchko C, Barnholtz-Sloan JS. CBTRUS statistical report: primary brain and other central nervous system tumors diagnosed in the United States in 2011–2015. Neuro-Oncology. (2018) 20:iv1–iv86. doi: 10.1093/neuonc/noy131 - DOI - PMC - PubMed
    1. Louis DN, Perry A, Wesseling P, Brat DJ, Cree IA, Figarella-Branger D, et al. The 2021 WHO classification of tumors of the central nervous system: a summary. Neuro-Oncology. (2021) 23:1231–51. doi: 10.1093/neuonc/noab106 - DOI - PMC - PubMed
    1. Tan AC, Ashley DM, López GY, Malinzak M, Friedman HS, Khasraw M. Management of glioblastoma: State of the art and future directions. CA A Cancer J Clin. (2020) 70:299–312. doi: 10.3322/caac.21613 - DOI - PubMed
    1. Stupp R, Weller M, Belanger K, Bogdahn U, Ludwin SK, Lacombe D, et al. Radiotherapy plus concomitant and adjuvant temozolomide for glioblastoma. New Engl J Medicine. (2005) 10:987–96. doi: 10.1056/NEJMoa043330 - DOI - PubMed
    1. Gangoso E, Southgate B, Bradley L, Rus S, Galvez-Cancino F, McGivern N, et al. Glioblastomas acquire myeloid-affiliated transcriptional programs via epigenetic immunoediting to elicit immune evasion. Cell. (2021) 184:2454–2470.e26. doi: 10.1016/j.cell.2021.03.023 - DOI - PMC - PubMed

LinkOut - more resources