

Dietary convergence induces individual responses in faecal microbiome composition
- PMID: 40548146
- PMCID: PMC12182192
- DOI: 10.1136/egastro-2024-100161
Dietary convergence induces individual responses in faecal microbiome composition
Abstract
Background: Dietary variation has been identified as a key contributor to microbiome diversification. However, assessing its true impact in a cross-sectional setting is complicated by biological confounders and methodological hurdles. We aimed to estimate the impact of a reduction of dietary variation (dietary convergence) on faecal microbiota composition among individuals consuming a Western-type diet.
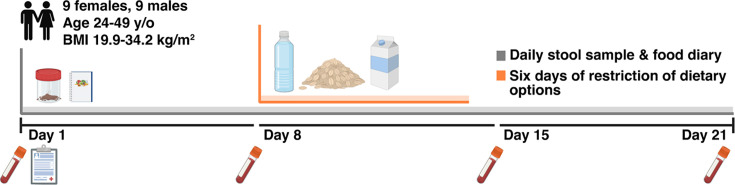
Methods: 18 healthy volunteers recruited in the region of Flanders (Belgium) were followed up for 21 days. Participants were allowed to consume their habitual diet during a baseline and follow-up period (7 and 8 days, respectively), intersected by a 6-day intervention during which dietary options were restricted to oat flakes, whole milk and still water. Faecal samples were collected on a daily basis. Quantitative microbiome profiles were constructed, combining 16S rRNA gene amplicon sequencing with flow cytometry cell counting. Blood samples were taken at the beginning and end of each study week.
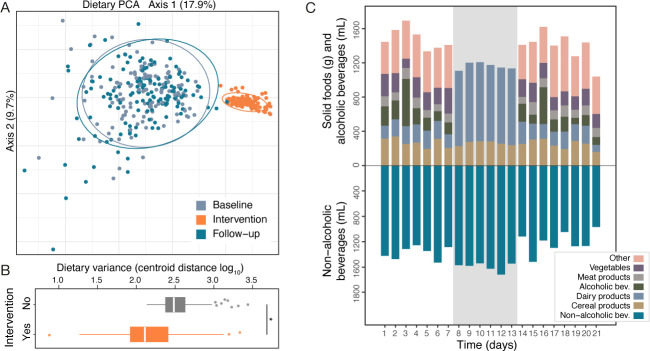
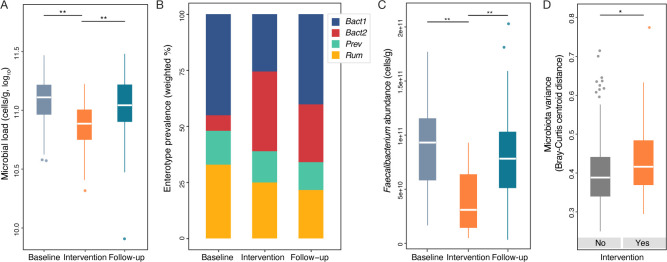
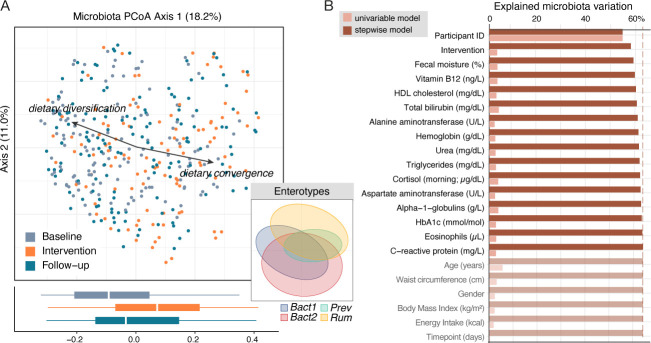
Results: While the intervention did not affect transit time (as assessed through the analysis of stool moisture), consumption of the restricted diet resulted in an increased prevalence of the Bacteroides2 microbiome community type. Microbial load and Faecalibacterium abundance decreased markedly. Despite dietary restrictions, no convergence of microbial communities (reduction of interindividual and intraindividual variation) was observed. The effect size (ES) of the intervention on genus-level microbiome community differentiation was estimated as 3.4%, but substantial interindividual variation was observed (1.67%-16.42%).
Conclusion: The impact of dietary variation on microbiome composition in a Western population is significant but limited in ES, with notable individual exceptions. Dietary convergence does not invariably translate into interindividual convergence of faecal microbial communities.
Keywords: Diet; Gastrointestinal microbiome; Intestinal microbiota; Microbiota; Nutrients; Prospective studies.
Copyright © Author(s) (or their employer(s)) 2025. Re-use permitted under CC BY-NC. No commercial re-use. See rights and permissions. Published by BMJ Group.
Conflict of interest statement
SV-S, JS, JR and GF are listed as inventors on patent WO2019115755A1 ‘A new inflammation-associated, low cell count enterotype’, in the name of VIB VZW, Katholieke Universiteit Leuven, KU Leuven R&D and Vrije Universiteit Brussel, covering the features of the microbiome associated with inflammation. SV-S, SP, JR and GF are credited as inventors on WO2022073973A1 ‘Means and methods to diagnose gut flora dysbiosis and inflammation’, in the name of VIB VZW, Katholieke Universiteit Leuven, KU Leuven R&D and University of Bristol, covering methods to diagnose and treat or reduce the severity of gut microbiota dysbiosis as well as of gastrointestinal inflammation and inflammation-associated disorders or conditions in a subject in need thereof. RYT and JR are included as inventors on the patent application WO2017109059A1, in the name of VIB VZW, Katholieke Universiteit Leuven, KU Leuven R&D and Universiteit Gent covering methods for detecting the presence or assessing the risk of development of inflammatory arthritis disease. SV received financial support for research from AbbVie, J&J, Pfizer, Takeda and Galapagos and speakers’ and/or consultancy fees from AbbVie, Abivax, AbolerIS Pharma, AgomAb, Alimentiv, Arena Pharmaceuticals, AstraZeneca, BMS, Boehringer Ingelheim, Celgene, Cytoki Pharma, Dr Falk Pharma, Ferring, Galapagos, Genentech-Roche, Gilead, GSK, Hospira, IMIDomics, Janssen, J&J, Lilly, Materia Prima, Mestag Therapeutics, MiroBio, Morphic, MRM Health, Mundipharma, MSD, Pfizer, Prodigest, Progenity, Prometheus, Robarts Clinical Trials, Surrozen, Takeda, Theravance, Tillotts Pharma AG, VectivBio, Ventyx, Zealand Pharma. All other authors declare no competing interests.
Figures
Comment on
-
Gut microbiota and immune alteration in cancer development: implication for immunotherapy.eGastroenterology. 2023 Jul 20;1(1):e100007. doi: 10.1136/egastro-2023-100007. eCollection 2023 Jun. eGastroenterology. 2023. PMID: 39944250 Free PMC article. Review.
-
Faecal microbiota transplantation for eradicating Helicobacter pylori infection: clinical practice and theoretical postulation.eGastroenterology. 2024 Dec 23;2(4):e100099. doi: 10.1136/egastro-2024-100099. eCollection 2024 Oct. eGastroenterology. 2024. PMID: 39944265 Free PMC article. Review.
-
Causal role of the gut microbiome in certain human diseases: a narrative review.eGastroenterology. 2024 Sep 10;2(3):e100086. doi: 10.1136/egastro-2024-100086. eCollection 2024 Sep. eGastroenterology. 2024. PMID: 39944364 Free PMC article. Review.
-
Bacterial dysbiosis and decrease in SCFA correlate with intestinal inflammation following alcohol intoxication and burn injury.eGastroenterology. 2025 Mar 14;3(1):e100145. doi: 10.1136/egastro-2024-100145. eCollection 2025. eGastroenterology. 2025. PMID: 40098807 Free PMC article.
Similar articles
-
Antiretrovirals for reducing the risk of mother-to-child transmission of HIV infection.Cochrane Database Syst Rev. 2007 Jan 24;(1):CD003510. doi: 10.1002/14651858.CD003510.pub2. Cochrane Database Syst Rev. 2007. Update in: Cochrane Database Syst Rev. 2011 Jul 06;(7):CD003510. doi: 10.1002/14651858.CD003510.pub3. PMID: 17253490 Updated.
-
Incentives for preventing smoking in children and adolescents.Cochrane Database Syst Rev. 2017 Jun 6;6(6):CD008645. doi: 10.1002/14651858.CD008645.pub3. Cochrane Database Syst Rev. 2017. PMID: 28585288 Free PMC article.
-
Signs and symptoms to determine if a patient presenting in primary care or hospital outpatient settings has COVID-19.Cochrane Database Syst Rev. 2022 May 20;5(5):CD013665. doi: 10.1002/14651858.CD013665.pub3. Cochrane Database Syst Rev. 2022. PMID: 35593186 Free PMC article.
-
Nutritional labelling for healthier food or non-alcoholic drink purchasing and consumption.Cochrane Database Syst Rev. 2018 Feb 27;2(2):CD009315. doi: 10.1002/14651858.CD009315.pub2. Cochrane Database Syst Rev. 2018. PMID: 29482264 Free PMC article.
-
Reminiscence therapy for dementia.Cochrane Database Syst Rev. 2018 Mar 1;3(3):CD001120. doi: 10.1002/14651858.CD001120.pub3. Cochrane Database Syst Rev. 2018. PMID: 29493789 Free PMC article.
References
Publication types
LinkOut - more resources
Full Text Sources