

EPHB1 Protein Promoted the Progression of Prostate Adenocarcinoma Through Phosphorylating GSK3B and Activating EPHB1-GSK3B-SMAD3 Pathway
- PMID: 40548257
- PMCID: PMC12178783
- DOI: 10.1155/humu/4961883
EPHB1 Protein Promoted the Progression of Prostate Adenocarcinoma Through Phosphorylating GSK3B and Activating EPHB1-GSK3B-SMAD3 Pathway
Abstract
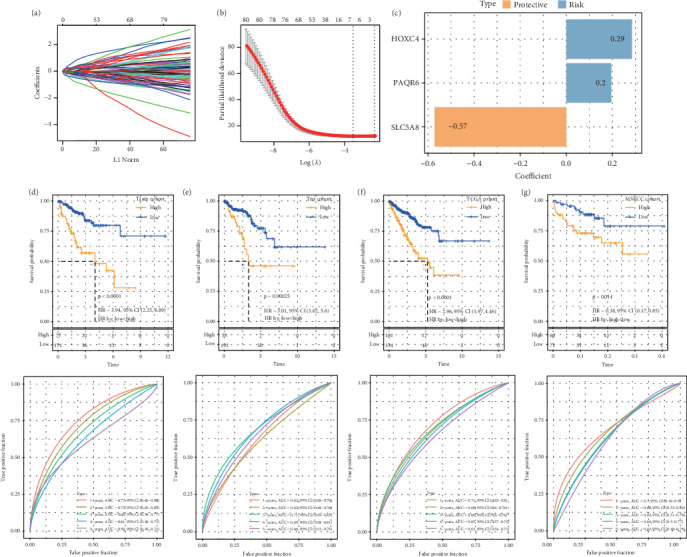
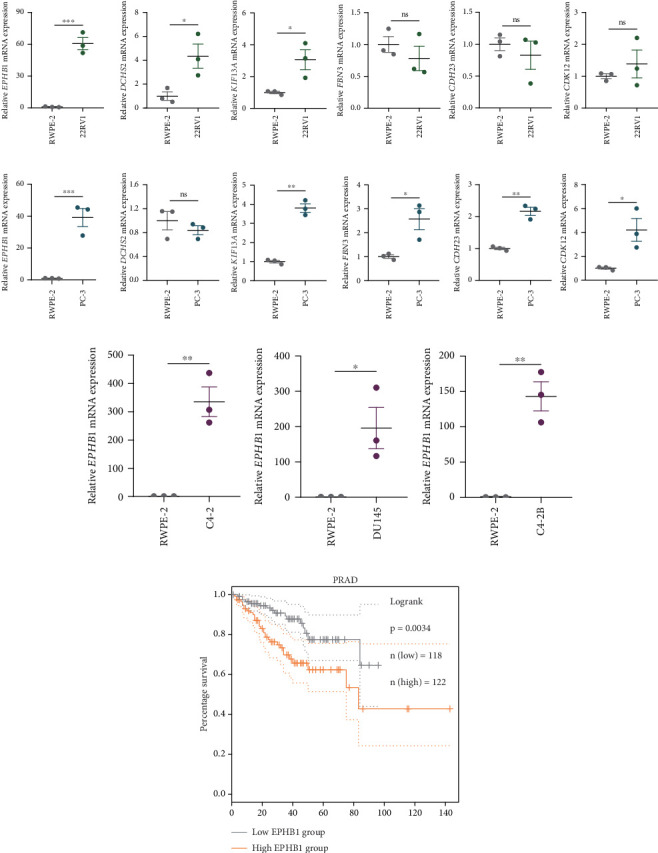
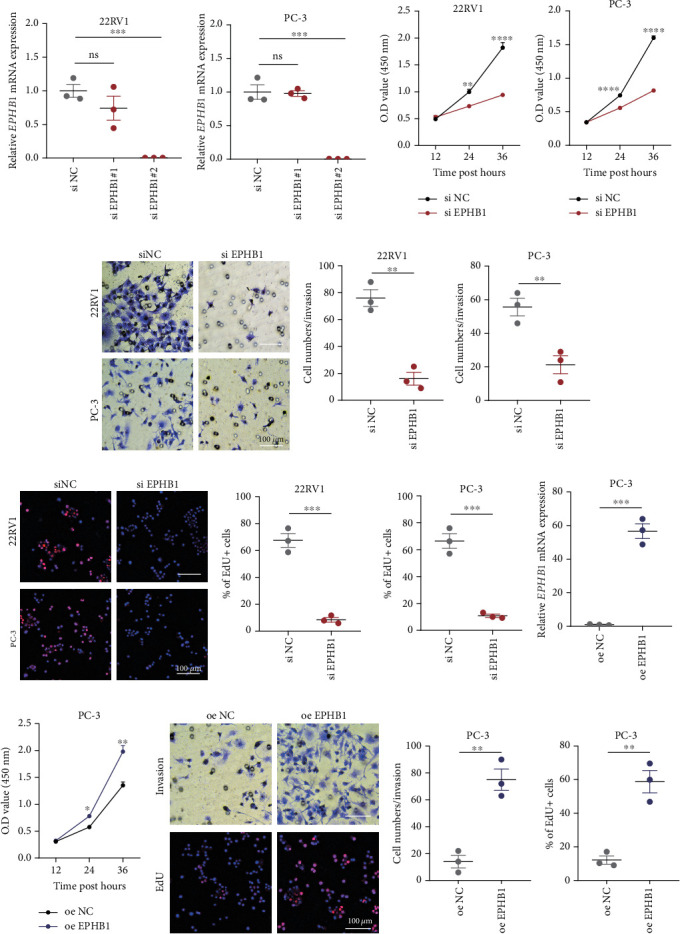
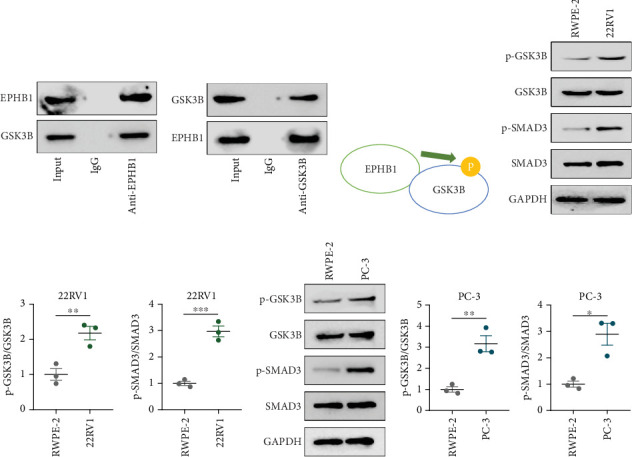
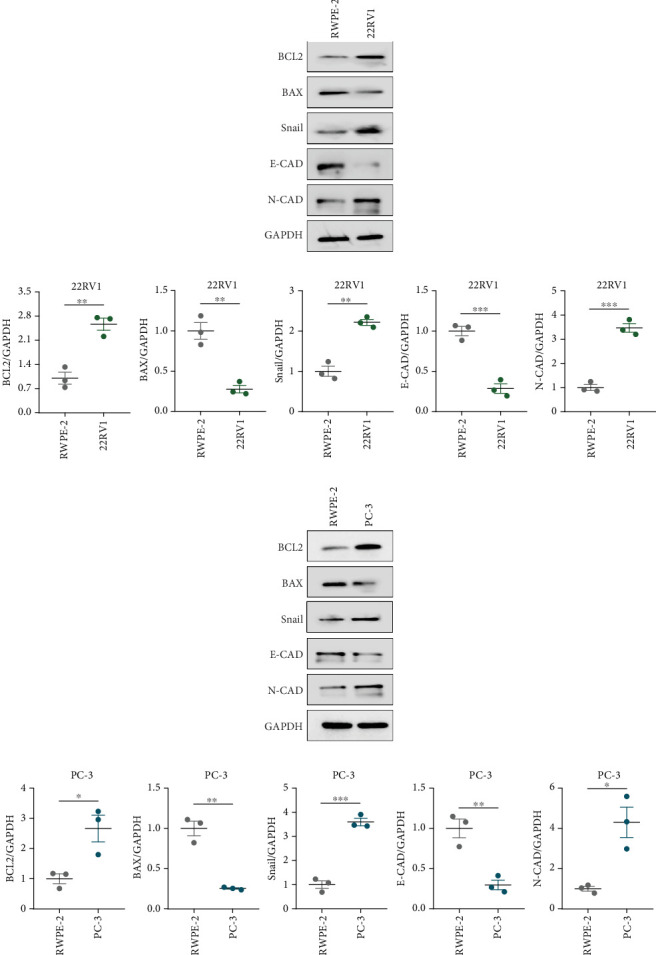
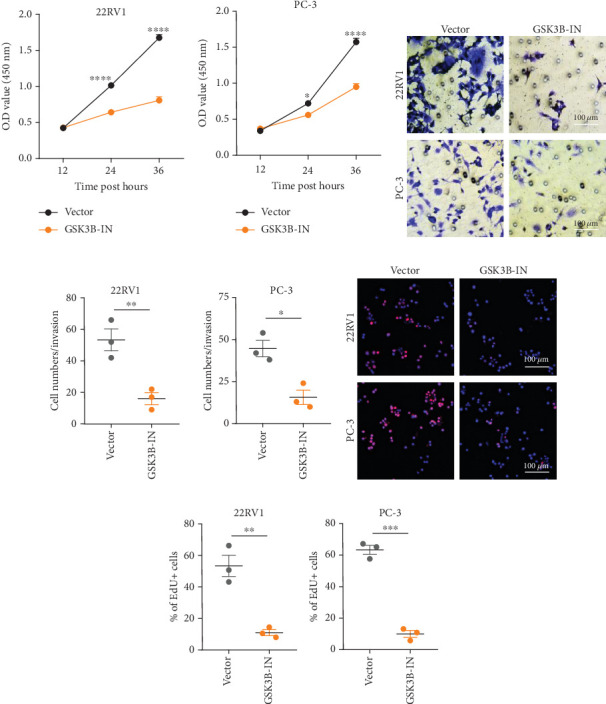
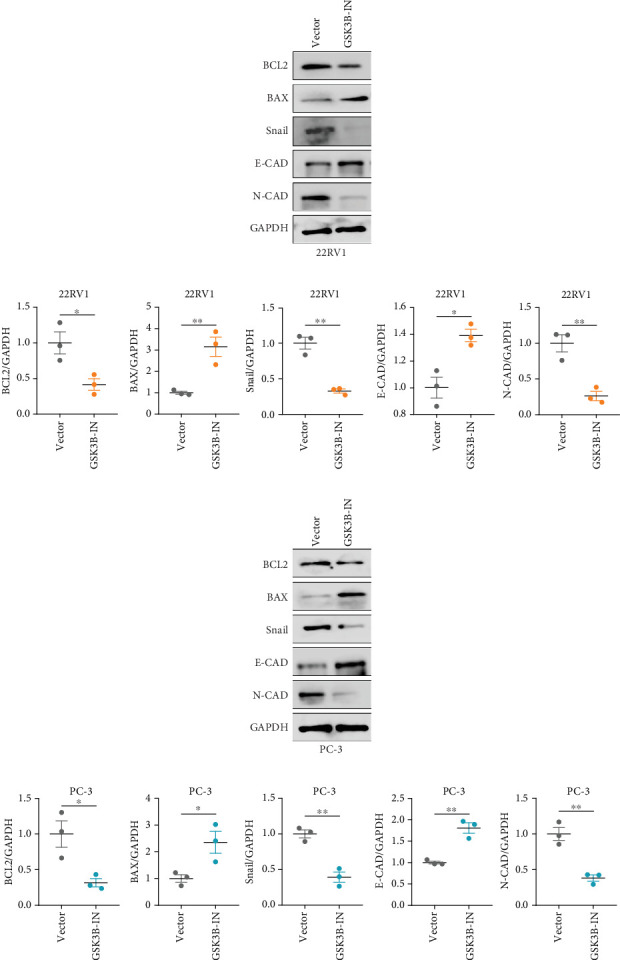
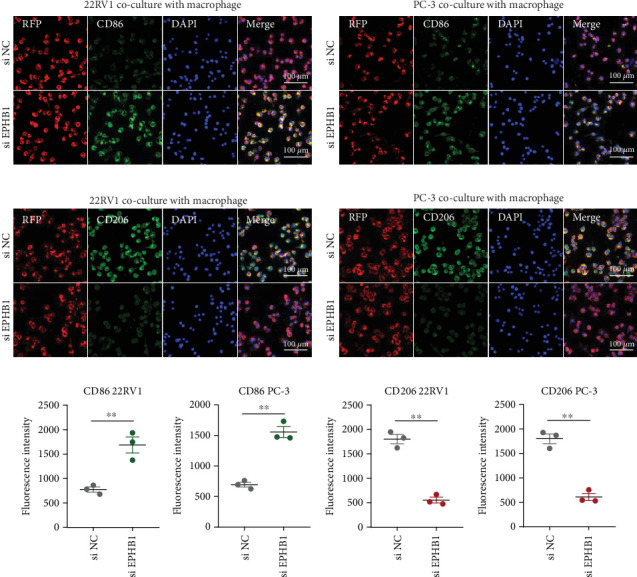
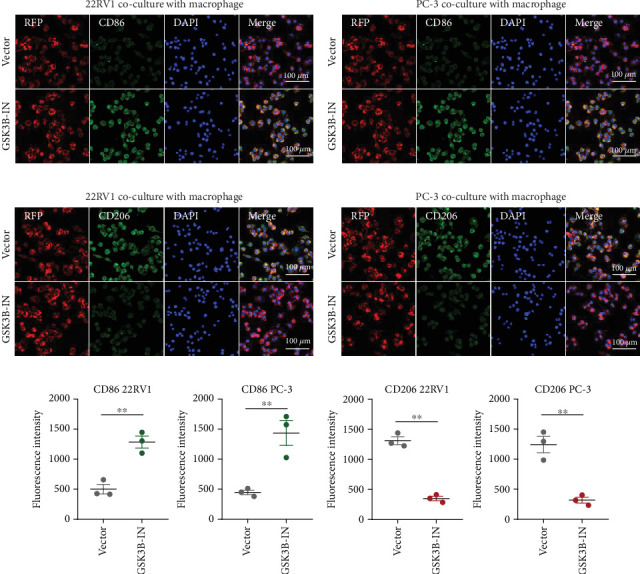
Background: The apoptosis affected the prostate adenocarcinoma (PRAD); we aimed to explore the potential pathogenesis of high-risk patients based on the apoptosis features. Method: The RNA-seq data of patients and apoptosis genes were used for apoptosis score calculation via "GSVA" package; then, the weighted gene coexpression network analysis (WGCNA) and Lasso algorithm were performed for a RiskScore model. After that, the "maftools" package was applied for the somatic mutation analysis. By combining the Kaplan-Meier (KM) survival curves in order to compare the prognosis of different subgroups of patients, Cell Counting Kit-8 (CCK-8), EdU staining, and Transwell assays were performed. Protein expression was measured using western blotting. Finally, the activity of PRAD cells in macrophage polarization was detected using coculture and immunofluorescence assays. Results: The PRAD samples had significantly lower apoptosis scores, and the RiskScore supported the risk stratification of patients. In somatic mutation analysis, EPHB1 and KIF13A from the top six mutant genes were overexpressed in 22RV1 and PC-3 tumor cells, and low levels of EPHB1 indicated a better prognosis. Overexpression or knockdown of EPHB1 affected cell viability, proliferation, and invasion. We found that high expression of EPHB1 interacting with GSK3B protein promoted the expression of p-SMAD3 in 22RV1 cells with high levels of antiapoptotic and invasion markers (BCL2, Snail, and N-CAD). Importantly, GSK3B and EPHB1 knockdown inhibited p-SMAD3 activation and promoted proapoptotic features, accompanied by a reduction in macrophage M2 polarization. Conclusion: This study revealed that EPHB1 plays a pivotal role in activating the EPHB1-GSK3B-SMAD3 pathway to facilitate PRAD progression.
Keywords: apoptotic characteristics; cell coculture; co-immunoprecipitation; prostate adenocarcinoma; western blot.
Copyright © 2025 Bohan Xu et al. Human Mutation published by John Wiley & Sons Ltd.
Conflict of interest statement
The authors declare no conflicts of interest.
Figures

Similar articles
-
TOR1 AIP1 interacts with p53 to enhance cell cycle dysregulation in prostate cancer progression.Mol Cell Biochem. 2025 Jul;480(7):4483-4497. doi: 10.1007/s11010-025-05276-1. Epub 2025 Apr 8. Mol Cell Biochem. 2025. PMID: 40198519 Free PMC article.
-
Prognostic value of LncRNA PSMA3-AS1 in prostate cancer and its potential regulatory mechanism.Hereditas. 2025 Jul 12;162(1):127. doi: 10.1186/s41065-025-00485-6. Hereditas. 2025. PMID: 40652273 Free PMC article.
-
Construction of a prostate adenocarcinoma molecular classification: integrating spatial transcriptomics with retrospective cohort validation.J Transl Med. 2025 Jul 1;23(1):717. doi: 10.1186/s12967-025-06661-6. J Transl Med. 2025. PMID: 40598508 Free PMC article.
-
Cost-effectiveness of using prognostic information to select women with breast cancer for adjuvant systemic therapy.Health Technol Assess. 2006 Sep;10(34):iii-iv, ix-xi, 1-204. doi: 10.3310/hta10340. Health Technol Assess. 2006. PMID: 16959170
-
Systemic pharmacological treatments for chronic plaque psoriasis: a network meta-analysis.Cochrane Database Syst Rev. 2021 Apr 19;4(4):CD011535. doi: 10.1002/14651858.CD011535.pub4. Cochrane Database Syst Rev. 2021. Update in: Cochrane Database Syst Rev. 2022 May 23;5:CD011535. doi: 10.1002/14651858.CD011535.pub5. PMID: 33871055 Free PMC article. Updated.
References
-
- Carneiro A., Baccaglini W., Glina F. P. A., et al. Impact of Local Treatment on Overall Survival of Patients With Metastatic Prostate Cancer: Systematic Review and Meta-Analysis. International Brazilian Journal of Urology . 2017;43(4):588–599. doi: 10.1590/S1677-5538.IBJU.2016.0483. - DOI - PMC - PubMed
MeSH terms
Substances
LinkOut - more resources
Full Text Sources
Medical
Research Materials
Miscellaneous
