. 2025 Jun 13:2025:7061507.
doi: 10.1155/mi/7061507. eCollection 2025.

Immune Regulation and ECM-Related Pathway Enrichment Reveal ATP2A3 as a Prognostic Biomarker for Nonspecific Orbital Inflammation: An Integrated Machine Learning and Mendelian Randomization Analysis

Affiliations

Immune Regulation and ECM-Related Pathway Enrichment Reveal ATP2A3 as a Prognostic Biomarker for Nonspecific Orbital Inflammation: An Integrated Machine Learning and Mendelian Randomization Analysis

Zixuan Wu et al. Mediators Inflamm. .

Abstract

Background: Nonspecific orbital inflammation (NSOI) is a heterogeneous inflammatory disorder of the orbit with an unclear etiology. ATP2A3, a key regulator of calcium homeostasis in the endoplasmic reticulum (ER), may play a pivotal role in NSOI pathogenesis. Its potential as a diagnostic biomarker merits thorough investigation. Methods: Differentially expressed genes (DEGs) common to two GEO datasets (GSE58331 and GSE105149) were intersected with immune-related genes from the ImmPort database, yielding 89 candidates. ATP2A3 was prioritized using machine learning (ML) approaches, including LASSO, support vector machine (SVM)-RFE, and weighted gene coexpression network analysis (WGCNA). Functional enrichment was assessed using GSEA and GSVA based on genes co-expressed with ATP2A3. Immune microenvironment characteristics were evaluated using CIBERSORT and ESTIMATE. Expression of ATP2A3 was validated in GSE105149. Results: Fifteen hub genes were identified, with ATP2A3 strongly linked to immune-related pathways. Genes positively correlated with ATP2A3 were enriched in sensory perception and extracellular matrix (ECM) organization. Immune infiltration analysis revealed a positive association between ATP2A3 expression and memory B cells, M2 macrophages, resting mast cells, monocytes, and regulatory T cells (Tregs), while naive B cells and plasma cells were negatively associated. ATP2A3 exhibited significant diagnostic potential for distinguishing NSOI. Conclusions: In the context of NSOI, we identify ATP2A3 as a novel contributor to immune-driven pathogenesis. Its significant dysregulation in NSOI tissues relative to healthy controls underscores its potential as a prognostic marker within the inflammatory microenvironment.

Keywords: ATP2A3; Lasso regression; Mendelian randomization; autoimmune inflammatory disorder; nonspecific orbital inflammation (NSOI).


Conflict of interest statement

The authors declare no conflicts of interest.

Figures

Figure 1
Figure 1
Framework.
Figure 2
Figure 2
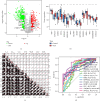
Principal component analysis and model. (a–d) PCA results. Note: Red is GSE1-5149; green is GSE58331. (e) Heatmap of DEGs. (f) Volcano plot of DEGs. (g, h) Soft threshold power mean connection and scale-free fitting index analysis. (i) Clustering of dendrograms. (j, k) Heatmap of correlations between module eigengenes and clinical characteristics. Note: In type, purple is the expression in NSOI, and light blue is the expression in control. In the vertical axis, red indicates high expression, blue indicates low expression, and the darker the color, the more significant the expression. (l) Gene scatterplot in the blue module.
Figure 3
Figure 3
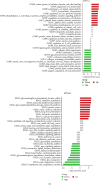
Construction of the model and enrichment analysis. (a) VNN. (b) ROC of the dataset. (c) Machine learning. (d) Validation of dataset. Note: Darker color (dark blue, dark red, etc.) indicates that the larger the value in that cell, that is, these kinds of predictions are more frequent. Lighter color indicates a smaller value in that cell. (e) GO analysis. (f) KEGG analysis. Note: The longer bar means the more genes enriched, and the increasing depth of red means the differences were more obvious. The GO circle shows the scatter map of the log FC of the specified gene. The higher the Z-score value indicated, the higher expression of the enriched pathway.
Figure 4
Figure 4
Identification of model gene. (a) Volcano plot. (b, c) Expression of model genes. Note: Blue indicates expression in the control group and red indicates expression in the NSOI group. The ordinate indicates the expression content of the gene in the two groups. p Values were showed as: p  < 0.05; ∗∗p < 0.01; ∗∗∗p  < 0.001. (d) AUC of 15 hub genes.
Figure 5
Figure 5
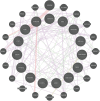
Coexpression network of model genes. Note: The red line represents stronger connectivity and the purple is slightly weaker. Thicker lines represent stronger connectivity.
Figure 6
Figure 6
GSEA of ATP2A3. (a, c) GSEA of GO analysis. (b, d) GSEA of KEGG analysis. p < 0.05; ∗∗p < 0.01; ∗∗∗p < 0.001.
Figure 7
Figure 7
GSVA of ATP2A3. (a) GSVA of GO analysis. (b) GSVA of KEGG analysis.
Figure 8
Figure 8
Immune landscape characterization. (a) Immune function and cells. (b, c) Correlation rectangle plot. (Red line: positive correlation; blue line: negative correlation. The depth of the colors reflects the strength of the relevance). (d) Lollipop plot. (e) LinkET plot. (f) Immune infiltration analyses. p < 0.05; ∗∗p < 0.01; ∗∗∗p < 0.001.
Figure 9
Figure 9
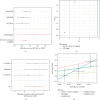
Mendelian randomization analysis. (a) Correlation rectangle plot. (b) Heatmap. (c) The expression patterns of correlation coefficient. (d) SNP effect on NSOI.

Similar articles

References

    1. Eshraghi B., Dehghan A., Javadi N., Fazel M. Nonspecific Orbital Inflammation and Thyroid Eye Disease, a Rare Comorbidity: Report of Two Cases and Review of Literature. BMC Ophthalmology . 2021;21(1) doi: 10.1186/s12886-021-02008-z.251 - DOI - PMC - PubMed
    1. Nalcacioglu P., Acaroglu G. Unilateral Optic Perineuritis Due to Nonspecific Orbital Inflammation: A Case Report. Orbit . 2017;36(6):452–455. doi: 10.1080/01676830.2017.1337185. - DOI - PubMed
    1. Garrity J. A. Not a Tumor-Nonspecific Orbital Inflammation. Journal of Neurological Surgery Part B: Skull Base . 2021;82(1):96–99. doi: 10.1055/s-0040-1722636. - DOI - PMC - PubMed
    1. Braich P. S., Kuriakose R. K., Khokhar N. S., Donaldson J. C., McCulley T. J. Factors Associated With Multiple Recurrences of Nonspecific Orbital Inflammation Aka Orbital Pseudotumor. International Ophthalmology . 2018;38(4):1485–1495. doi: 10.1007/s10792-017-0610-7. - DOI - PubMed
    1. Eshraghi B., Sonbolestan S. A., Abtahi M.-A., Mirmohammadsadeghi A. Clinical Characteristics, Histopathology, and Treatment Outcomes in Adult and Pediatric Patients With Nonspecific Orbital Inflammation. Journal of Current Ophthalmology . 2019;31(3):327–334. doi: 10.1016/j.joco.2019.03.004. - DOI - PMC - PubMed

MeSH terms

Substances

LinkOut - more resources