

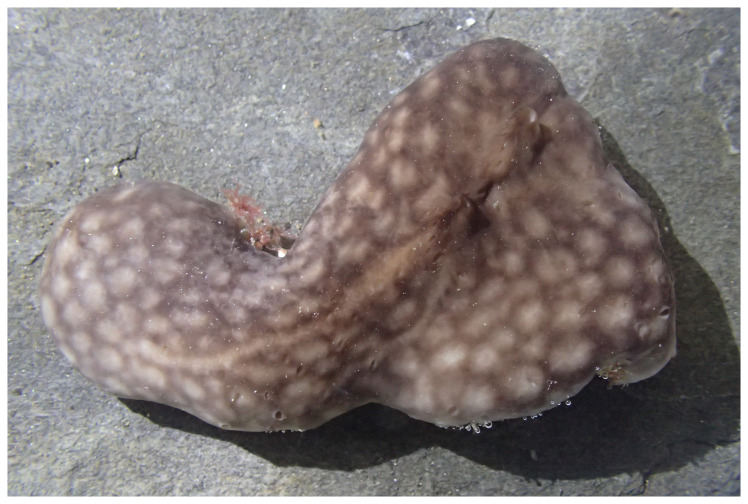
The chromosomal genome sequence of the kidney sponge, Chondrosia reniformis Nardo, 1847, and its associated microbial metagenome sequences
- PMID: 40548332
- PMCID: PMC12181767
- DOI: 10.12688/wellcomeopenres.24166.1
The chromosomal genome sequence of the kidney sponge, Chondrosia reniformis Nardo, 1847, and its associated microbial metagenome sequences
Abstract
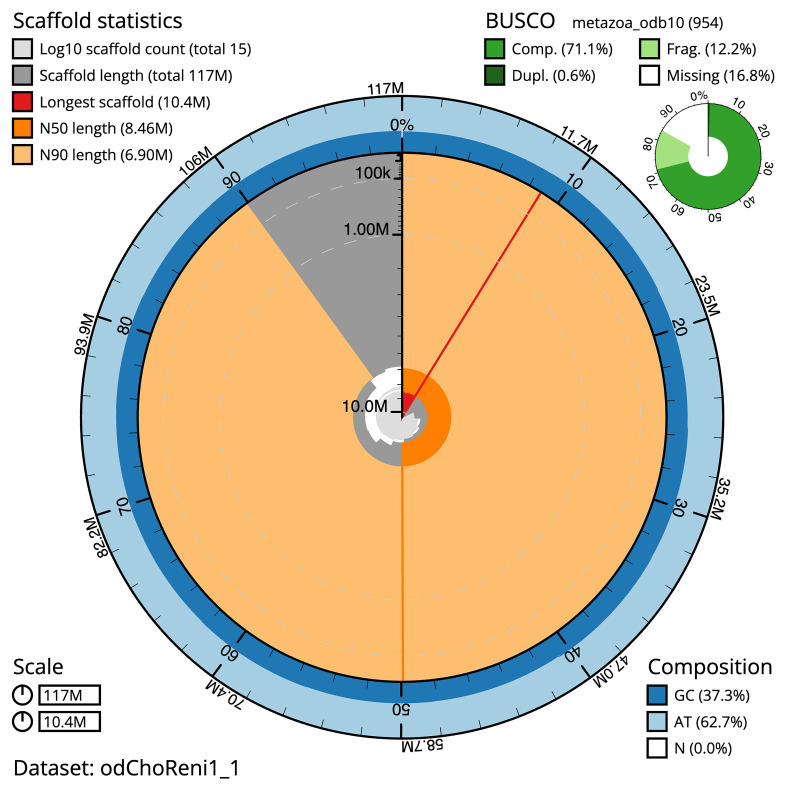
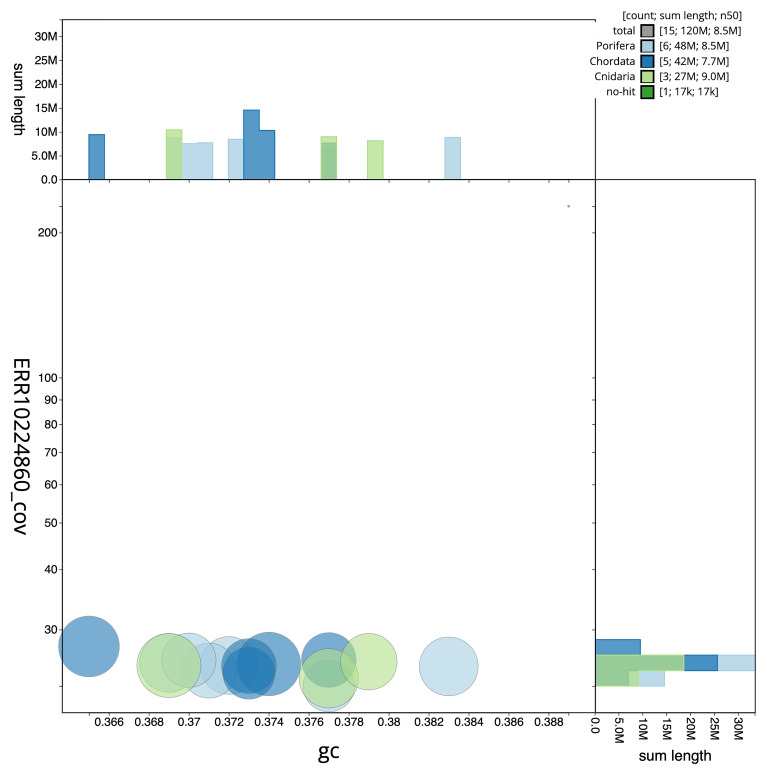
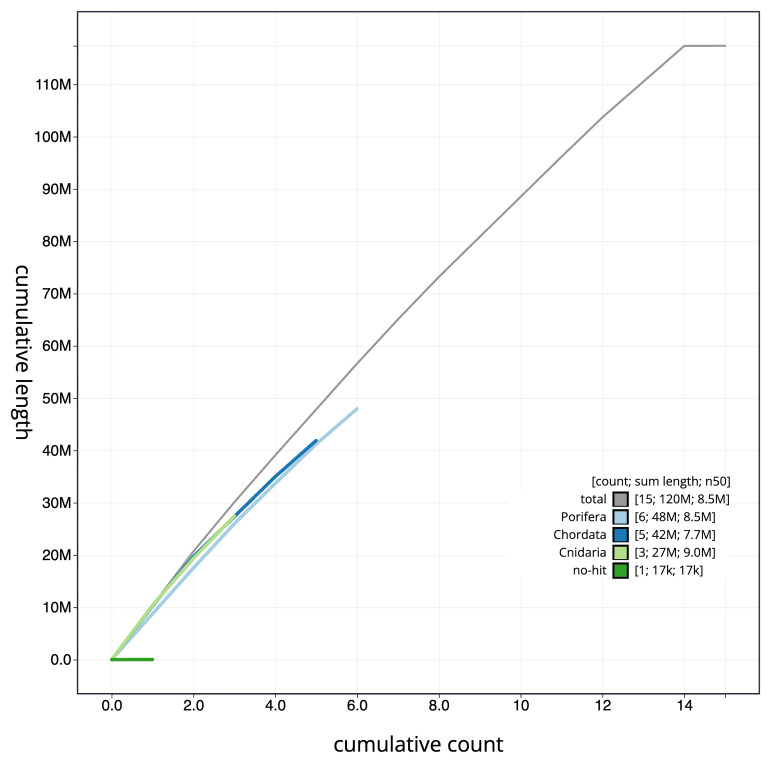
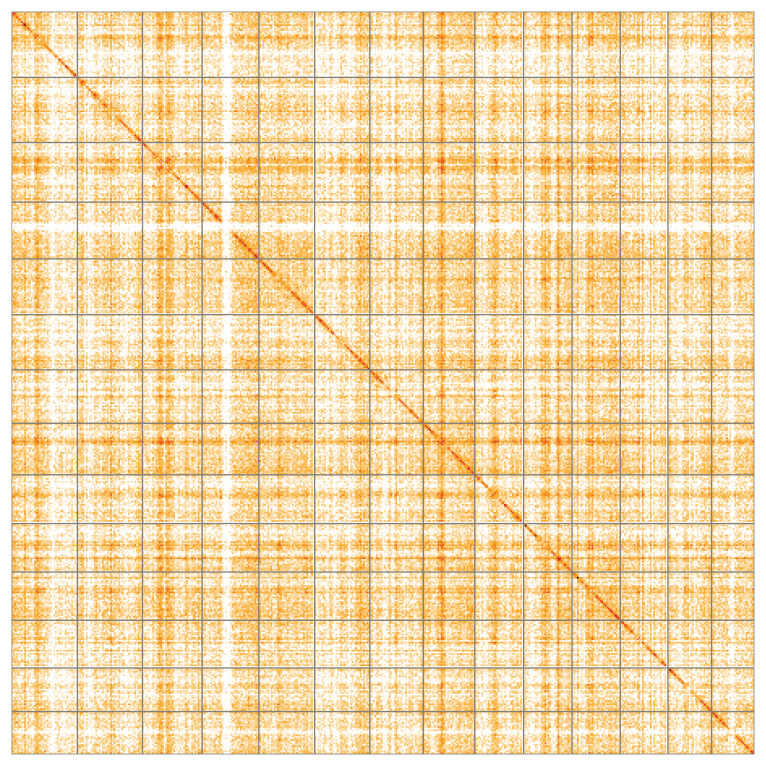
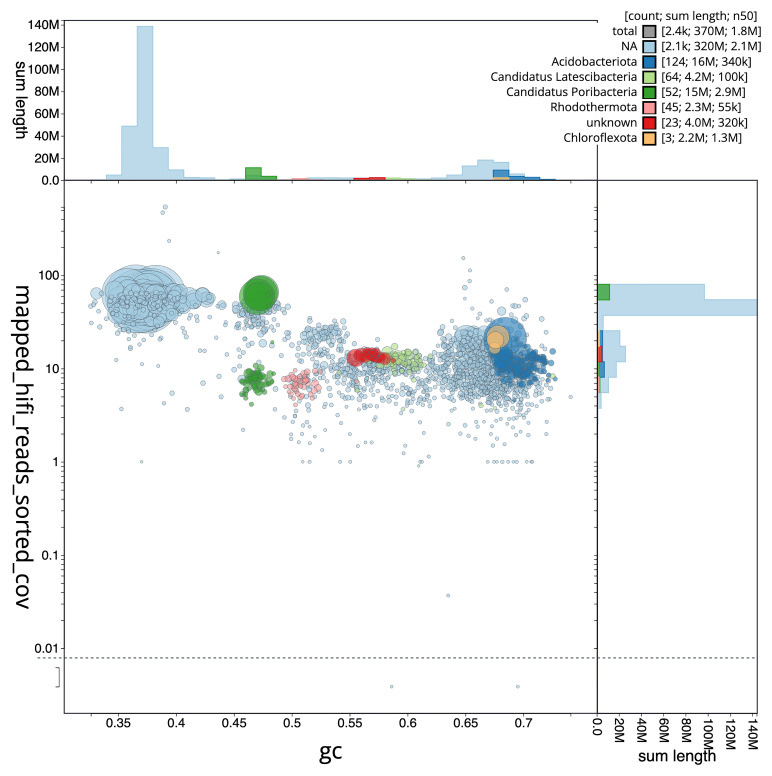
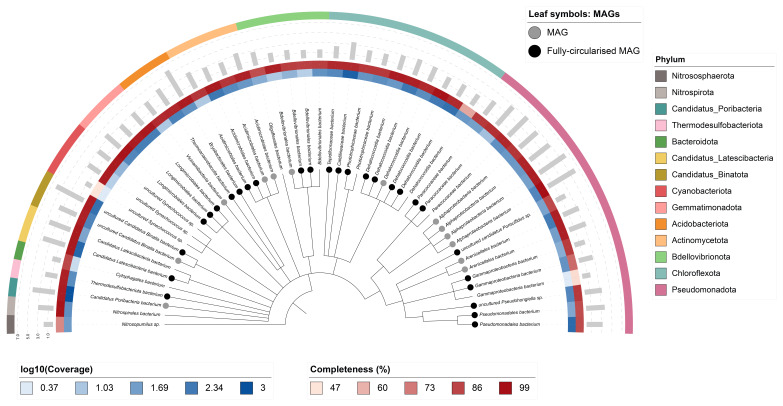
We present a genome assembly from a specimen of Chondrosia reniformis (kidney sponge; Porifera; Demospongiae; Chondrillida; Chondrillidae). The genome sequence has a total length of 117.37 megabases. Most of the assembly (99.98%) is scaffolded into 14 chromosomal pseudomolecules. The mitochondrial genome has also been assembled and is 17.45 kilobases in length. Several symbiotic bacterial genomes were assembled as MAGs. Gene annotation of the host organism assembly on Ensembl identified 17,340 protein-coding genes. The metagenome of the specimen was also assembled and 53 binned bacterial genomes were identified, including 40 high-quality MAGs that were representative of a typical high microbial abundance sponge and included three candiate phyla (Poribacteria, Latescibacteria, Binatota).
Keywords: Chondrillida; microbial metagenome; Chondrosia reniformis; chromosomal; genome sequence; kidney sponge.
Copyright: © 2025 Pita L et al.
Conflict of interest statement
No competing interests were disclosed.
Figures
Similar articles
-
The chromosomal genome sequence of the marine leech, Branchellion lobata Moore, 1952 and its associated microbial metagenome sequences.Wellcome Open Res. 2025 Jun 2;10:304. doi: 10.12688/wellcomeopenres.24186.1. eCollection 2025. Wellcome Open Res. 2025. PMID: 40771652 Free PMC article.
-
The genome sequence of the greater argentine, Argentina silus (Ascanius, 1775).Wellcome Open Res. 2025 Mar 17;10:131. doi: 10.12688/wellcomeopenres.23691.1. eCollection 2025. Wellcome Open Res. 2025. PMID: 40574744 Free PMC article.
-
The genome sequence of a soldier fly, Nemotelus pantherinus (Linnaeus, 1758).Wellcome Open Res. 2025 Jun 2;10:303. doi: 10.12688/wellcomeopenres.24309.1. eCollection 2025. Wellcome Open Res. 2025. PMID: 40548330 Free PMC article.
-
Antidepressants for pain management in adults with chronic pain: a network meta-analysis.Health Technol Assess. 2024 Oct;28(62):1-155. doi: 10.3310/MKRT2948. Health Technol Assess. 2024. PMID: 39367772 Free PMC article.
-
Single-incision sling operations for urinary incontinence in women.Cochrane Database Syst Rev. 2017 Jul 26;7(7):CD008709. doi: 10.1002/14651858.CD008709.pub3. Cochrane Database Syst Rev. 2017. Update in: Cochrane Database Syst Rev. 2023 Oct 27;10:CD008709. doi: 10.1002/14651858.CD008709.pub4. PMID: 28746980 Free PMC article. Updated.
References
Associated data
Grants and funding
LinkOut - more resources
Full Text Sources
