. 2025 Jun 23;10(12):e187381.
doi: 10.1172/jci.insight.187381.

Resident memory T cell development is gradual and shows AP-1 gene expression in mature cells

Affiliations

Resident memory T cell development is gradual and shows AP-1 gene expression in mature cells

Neal P Smith et al. JCI Insight. .

Abstract

Tissue-resident memory T (TRM) cells play a central role in immune responses across all barrier tissues after infection. However, the mechanisms that drive TRM differentiation and priming for their recall effector function remains unclear. In this study, we leveraged newly generated and publicly available single-cell RNA-seq data generated across 10 developmental time points to define features of CD8+ TRM across both skin and small-intestine intraepithelial lymphocytes (siIEL). We employed linear modeling to capture gene programs that increase their expression levels in T cells transitioning from an effector to a memory state. In addition to capturing tissue-specific gene programs, we defined a temporal TRM signature across skin and siIEL that can distinguish TRM from circulating T cell populations. This TRM signature highlights biology that is missed in published signatures that compared bulk TRM to naive or nontissue resident memory populations. This temporal TRM signature included the AP-1 transcription factor family members Fos, Fosb, Fosl2, and Junb. ATAC-seq analysis detected AP-1-specific motifs at open chromatin sites in mature TRM. Cyclic immunofluorescence (CyCIF) tissue imaging detected nuclear colocalization of AP-1 members in resting CD8+ TRM greater than 100 days after infection. Taken together, these results reveal a critical role of AP-1 transcription factor members in TRM biology.

Keywords: Adaptive immunity; Immunology; Inflammation; T cell development.


Figures
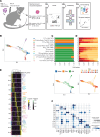
Figure 1
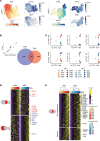
Figure 1. scRNA-seq of dLN and skin T cells in a viral infection model over time.
(A) Schematic of the experimental design. (B) Force-directed layout embedding (FLE) of 63,265 high-quality single cells, colored by predicted Leiden cluster listed on the right. (C and D) (top) Source (C) and time point (D) composition of every cluster. Bars represent the fraction of cells in every cluster that were derived from the corresponding source or time point. (bottom) FLE embedding of cells pseudocolored by tissue source (C) or time point (D). (E) Heatmap showing the top discriminative gene sets for each cell cluster compared with every other cluster. Color scales denote the normalized gene expression (mean zero, unit variance) for each cluster and the mean number of genes captured per cluster (top bar). (F) Dot plot showing the percentage (size of the dot) and scaled expression (color) of known T-cell subset marker genes.
Figure 2
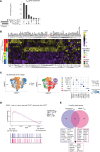
Figure 2. Heterogeneity of antigen-specific T cells early postinfection and transcription factors the drive memory T cell differentiation.
(A) (left) FLE of clusters most associated with day 5 dLN cells (C8, C9, and C10). (right) Dot plot showing the percentage (size of the dot) and scaled expression (color) of select marker genes for each of the 3 clusters. (B) Pairwise Spearman correlation between the OVA log2 fold-change values of clusters C8, C9, and C10 versus C2, C6, and C3. (C) A growth rate was calculated by comparing the relative expression of genes involved in proliferation versus apoptosis. Histograms show distribution of this growth rate across all cells when grouped by cluster (upper panel) or grouped by time point (lower panel). (D) Probabilities of cells reaching the C1 (top) or C3 macrostate (bottom) as determined by absorption probabilities. Color scale represents probability of a cell to reach the given cell state (blue, low probability; yellow, high probability). (E) Transcription factors most associated with each Waddington-OT determined mature cell state. The top 10 transcription factors associated with C3 state (left, top) and C1 state (right, bottom) are labeled. (F) Schematic of the ATAC-seq experimental design. (G) HOMER-known motif analysis comparing TRM and TCM samples profiled. Shown are the transcription factors and position weight matrices for the top 10 known motifs for TRM (left) and TCM (right).
Figure 3
Figure 3. Linear modeling reveals tissue-specific and consensus temporal TRM gene signature in viral infection models.
(A) Uniform Manifold Approximation and Projection (UMAP) embedding of skin (left) and siIEL scRNA-seq data (right) pseudocolored by experimental time point. To the right of each time point UMAP are feature plots using color to indicate gene expression levels (Log(CPM)) of Gzma and Itgae. (B) Venn diagram of the significant TRM-associated genes in siIEL (left) and skin (right) as determined by linear modeling. (C) Scatter plots showing the Log(CPM) of select skin-specific (top) and siIEL-specific (bottom) TRM genes on the y axis and Log(CPM) of Itgae on the x axis. Color scale indicates both anatomical location and time point the sample was from. (D) Heatmap showing the top 100 genes unique to the skin (top) and siIEL (bottom) TRM signatures. Top bar indicates the associated timepoints. Color scales denote the normalized gene expression (mean zero, unit variance) for each timepoint. (E) Heatmap showing the temporal TRM gene signature across timepoints in both skin (left) and siIEL (right) datasets. Color scale denotes normalized gene expression (mean zero, unit variance) for each timepoint. The genes on top represent those unique to the TRM signature genes (n = 100), while the genes on the bottom represent those additionally found in the TCIRC signature (n = 36). Transcription factors are labeled on the right.
Figure 4
Figure 4. Temporal TRM gene signature distinguishes TRM in mouse and human models.
(A) UpSet plot showing the overlap between our temporal TRM signature and two previously published signatures by Milner et al. (6) and Mackay et al. (16). Each column represents a unique intersection, as shown by the dark points in the dot-matrix. Bars for each column represent the size of the overlap between each combination. Bars on left represent the size of each unique TRM gene set. (B) Heatmap showing expression levels of our temporal TRM gene signature across T cell subset microarray samples publicly available from Mackay et al. (20). Color scales denote the normalized gene expression (mean zero, unit variance) for each sample. Genes listed in black are unique to our temporal TRM signature. Genes listed in red are those that are shared among all 3 TRM signatures. (C) UMAP embedding of 1,829 skin lymphocytes from a donor 796 days after allogenic hematopoietic stem cell transplantation (42) colored by T cell source (left) and annotated cell type (middle). (right) Dot plot showing the percentage (size of the dot) and scaled expression (color) of select marker genes for the annotated cell types. (D) Host versus donor-derived CD8+ T cells were compared and genes associated with each were ranked (highest rank = genes associated with host-derived CD8+ T cells, lowest rank = genes associated with donor-derived T cells). This ranking was used as input to GSEA using the temporal TRM gene set and the TRM gene set published by Milner et al. (6). (E) Venn diagram of the leading edge genes associated with the GSEA analysis shown in D.
Figure 5
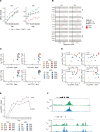
Figure 5. AP-1 transcription factor family members correlate with TRM development.
(A) Mean SCENIC Aucell scores for select regulons over time in the skin (left) and siIEL (right). Each line represents a unique regulon and the points represent the mean AUCell score for the regulon at the experimental timepoint. (B) linear modeling of AP-1 subfamilies in skin and siIEL. Each row is a gene with dots indicating the regression slope and 95% confidence interval from linear modeling of expression over time. Color indicates if it met our criteria to be considered a temporal-TRM gene (FDR < 0.1, % cells > 5, regression slope > 0.15). (C) Expression of Fos-family genes and Junb versus Itgae over time in skin and siIEL. Each point represents a sample detailed in the legend that is shared with (D), and the x- and y-axes represent the Log(CPM) of Itgae and Fos family members, respectively. (D) Scatter plots showing the Log(CPM) of Tbx21 on the y-axis and Log(CPM) of Fosl2, Fos, Fosb, and Junb on the x axis across skin and siIEL timepoints. Color scale indicates both anatomical location and experimental timepoint from which the sample came from. r and P values are from Pearson correlation. (E) Tbx21 expression in skin and siIEL over time. The x axis represents time while the y axis represents Log(CPM) of Tbx21. Dots are connected by their neighboring timepoints. (F) ATAC-seq tracks from our TRM and TCM samples at the Dusp1 and Fosb loci. Dotted line represents location of predicted Fos binding motif enriched in TRM versus TCM.
Figure 6
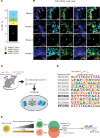
Figure 6. AP-1 is located in the nucleus of TRM and are bound to sites of NFAT motifs.
(A) Quantification of CD8+CD103+ skin TRM as detected by t-CyCIF, broken down by the presence of cFos and JunB staining. The numbers in the boxes represent the number of cells in each category. 159 CD8+ CD11c cells were identified from the tail and ear skin from 5 mice. (B) t-CyCIF images of mouse tail skin epidermis 154 days after rVACV-OVA vaccination. Duplex and composite images of highlighted CD8+ TRM cell expressing CD8 (red), JunB (cyan), and cFos (green) and CD103 (yellow). Arrows indicate TRM cells with positive JunB and cFos staining when multiple cells are in the same field of view. Scale bars: 10 μm.(C) Schematic of the CUT&RUN experimental design. Schematic created using BioRender (https://biorender.com). (D) HOMER-known motif analysis comparing TRM and TCM CUT&RUN samples profiled. Shown are the transcription factors and position weight matrices for the top 10 known motifs for TRM. NFAT motifs are bolded. (E) Summary of major findings.

References

    1. Mosmann TR, et al. Two types of murine helper T cell clone. I. Definition according to profiles of lymphokine activities and secreted proteins. J Immunol. 1986;136(7):2348–2357. doi: 10.4049/jimmunol.136.7.2348. - DOI - PubMed
    1. Sallusto F, et al. Two subsets of memory T lymphocytes with distinct homing potentials and effector functions. Nature. 1999;401(6754):708–712. doi: 10.1038/44385. - DOI - PubMed
    1. Rotrosen E, Kupper TS. Assessing the generation of tissue resident memory T cells by vaccines. Nat Rev Immunol. 2023;23(10):655–665. doi: 10.1038/s41577-023-00853-1. - DOI - PMC - PubMed
    1. Mackay LK, et al. Hobit and Blimp1 instruct a universal transcriptional program of tissue residency in lymphocytes. Science. 2016;352(6284):459–463. doi: 10.1126/science.aad2035. - DOI - PubMed
    1. Fonseca R, et al. Runx3 drives a CD8+ T cell tissue residency program that is absent in CD4+ T cells. Nat Immunol. 2022;23(8):1236–1245. doi: 10.1038/s41590-022-01273-4. - DOI - PubMed

MeSH terms