. 2025 Jun 23;10(12):e191872.
doi: 10.1172/jci.insight.191872.

Lipidomic profiling of human adiposomes identifies specific lipid shifts linked to obesity and cardiometabolic risk

Affiliations

Lipidomic profiling of human adiposomes identifies specific lipid shifts linked to obesity and cardiometabolic risk

Abeer M Mahmoud et al. JCI Insight. .

Abstract

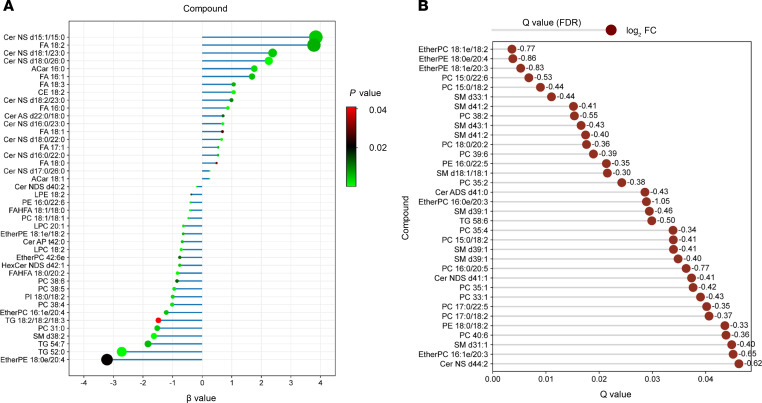
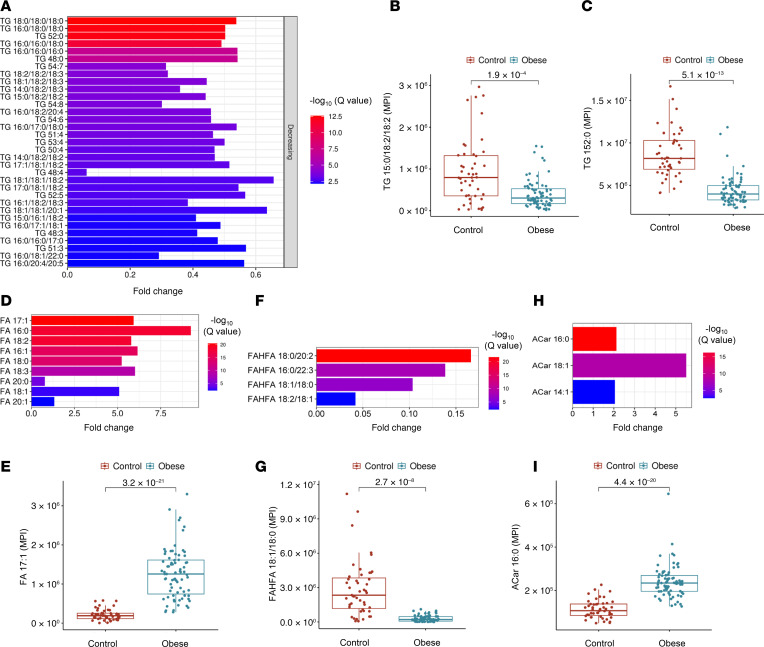
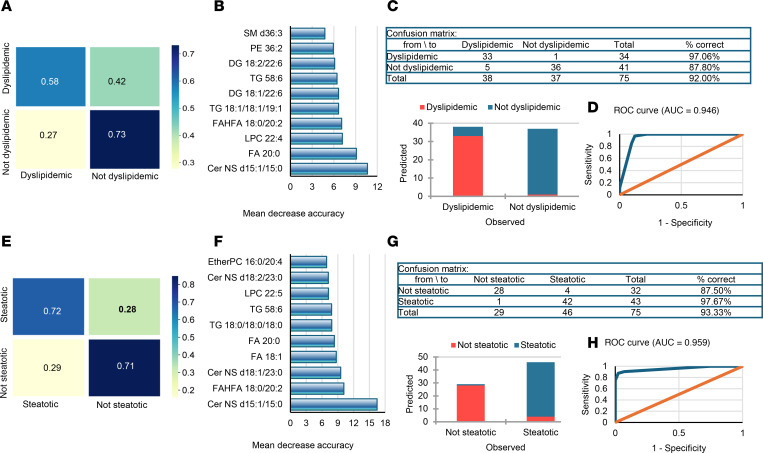
BACKGROUNDObesity, a growing health concern, often leads to metabolic disturbances, systemic inflammation, and vascular dysfunction. Emerging evidence suggests that adipose tissue-derived extracellular vesicles (adiposomes) may propagate obesity-related complications. However, their lipid composition and effect on cardiometabolic state remain unclear.METHODSThis study examined the lipid composition of adiposomes in 122 participants (75 in obesity group, 47 in lean group) and its connection to cardiometabolic risk. Adiposomes were isolated via ultracentrifugation and characterized using nanoparticle tracking and comprehensive lipidomic analysis by mass spectrometry. Cardiometabolic assessments included anthropometry, body composition, glucose-insulin homeostasis, lipid profiles, inflammatory markers, and vascular function.RESULTSCompared with lean controls, individuals with obesity exhibited elevated adiposome release and shifts in lipid composition, including higher ceramides, free fatty acids, and acylcarnitines, along with reduced levels of phospholipids and sphingomyelins. These alterations strongly correlated with increased BMI, insulin resistance, systemic inflammation, and impaired vascular function. Pathway enrichment analyses highlight dysregulation in glycerophospholipid and sphingolipid metabolism, bile secretion, proinflammatory pathways, and vascular contractility. Machine-learning models utilizing adiposome lipid data accurately classified obesity and predicted cardiometabolic conditions, such as diabetes, hypertension, dyslipidemia, and liver steatosis, achieving accuracy above 85%.CONCLUSIONObesity profoundly remodels the adiposome lipid landscape, linking lipid changes to inflammation, metabolic dysfunction, and vascular impairment. These findings underscore adiposome lipids as biomarkers for obesity and related cardiometabolic disorders, supporting personalized interventions and offering therapeutic value in risk stratification and treatment.FUNDINGThis project was supported by NIH grants R01HL161386, R00HL140049, P30DK020595 (PI: AMM), R01DK104927, and P30DK020595 as well as by a VA Merit Award (1I01BX003382, PI: BTL).

Keywords: Adipose tissue; Inflammation; Lipidomics; Metabolism; Obesity; Vascular biology.


Conflict of interest statement

Conflict of interest: The authors have declared that no conflict of interest exists.

Figures

Figure 1
Figure 1. A schematic illustration of the study design comparing individuals from the lean (n = 47) and obese (n = 75) groups.
Figure 2
Figure 2. Analysis of adiposomes and lipid alterations in individuals in the obese and lean groups.
(A) A representative image of the AT biopsy sample. (B) TEM image of adiposome particles. Scale bar: 200 nm. (C) Nanoparticle tracking analysis displaying adiposome particles in the samples. Original magnification ×20. (D) Quantification of adiposome concentration in obese and lean groups (Mann-Whitney U test). (E and F) Western blot analysis for EV biomarkers and adipocytic proteins. (G) Heatmap of adiposome lipid species across lean and obese groups. (H) Percentage composition of major lipid classes in the control and obese groups.
Figure 3
Figure 3. Differential adiposome lipids in individuals in the obese and lean groups.
(A) Principal Component Analysis (PCA) plot of adiposome lipids in obese and lean groups. (B) Volcano plot illustrates the differential lipid expression (log2 fold change) between obese and lean groups (–log10 P value; unpaired 2-tailed t test with multiple testing correction; Benjamini-Hochberg FDR).
Figure 4
Figure 4. Regression analysis and association of adiposome lipids with obesity status.
(A) Regression plot showing the association between lipid species and obesity status, arranged by their β values (linear regression) and their associated P values. (B) Horizontal lollipop chart shows the differential lipid abundance from class 2 and 3 individuals with obesity using log2 fold change to represent the magnitude of change. For statistical significance, an unpaired 2-tailed t test with multiple testing correction (Benjamini-Hochberg FDR) was used.
Figure 5
Figure 5. Differential phospholipid profiles in adiposomes of individuals in the obese and lean groups.
(A) Bar plot of fold changes in the top 69 phospholipid and lysophospholipid species between obese and control (lean) groups and their significance (–log10 q values). (BE) Box plots showing examples of the significantly altered phospholipid species between the obese and lean groups. For statistical significance, an unpaired 2-tailed t test with multiple testing correction (Benjamini-Hochberg FDR) was used. MPI, mean peak intensity.
Figure 6
Figure 6. Ceramide and sphingomyelin alterations in adiposomes of individuals in the obese and lean groups.
(A) Bar plot of fold changes in Cer and HexCer between obese and control groups and their significance (–log10 q values). (BE) Box plots of key Cer showing significant differences between groups. (F) Bar plot of fold changes in the expression levels of SM in obese and lean groups. (G and H) Box plots of selected SM species show significant differences between the control and obese groups. For statistical significance, an unpaired 2-tailed t test with multiple testing correction (Benjamini-Hochberg FDR) was used.
Figure 7
Figure 7. Differential profiles of triglycerides, fatty acids, FAHFAs, and acylcarnitines.
(A, D, F, and H) Bar plot of fold changes in TG species (A), fatty acid species (D), FAHFAs (F), and ACar species (H) between obese and control groups and their significance (–log10 q values [FDR]). (B, C, E, G, and I) Box plots illustrate altered TG species (B and C), FA 17:1 (E), FAHFA 18:1/18:0 (G), and ACar 16:0 (I) in the lean and obese groups. For statistical significance, an unpaired 2-tailed t test with multiple testing correction (Benjamini-Hochberg FDR) was used.
Figure 8
Figure 8. Lipidomic alterations in diabetic and hypertensive individuals.
(A and D) Stacked bar plots show the distribution of lipid classes (log2 FC and FDR values are provided in parentheses) in individuals with diabetes versus those without diabetes (A) and those who are hypertensive versus those who are nonhypertensive (D). (B, C, E, and F) Boxplots for lipids altered between diabetic versus nondiabetic groups (B and C) and hypertensive versus nonhypertensive groups (E and F). For statistical significance, an unpaired 2-tailed t test with multiple testing correction (Benjamini-Hochberg FDR) was used.
Figure 9
Figure 9. Lipidomic alterations in dyslipidemic individuals.
(A) Stacked bar plots show the distribution of lipid classes (log2 FC and FDR values in parentheses) in dyslipidemic versus nondyslipidemic individuals. (B and C) Box plots for lipids altered between dyslipidemic and nondyslipidemic groups. For statistical significance, an unpaired 2-tailed t test with multiple testing correction (Benjamini-Hochberg FDR) was used.
Figure 10
Figure 10. Total lipid classes and correlation with clinical parameters.
(AF) Box plots comparing total lipid class between obese and lean groups. (G) Correlation heatmap displaying the relationships between lipid classes and clinical parameters in individuals in the obese and lean groups. For statistical significance, an unpaired 2-tailed t test with multiple testing correction (Benjamini-Hochberg FDR) was used.
Figure 11
Figure 11. Correlation of lipidomic profiles with clinical parameters in participants with obesity.
(AJ) Scatter plots of lipid levels with cardiometabolic markers in the obese group. Pearson correlation test was used.
Figure 12
Figure 12. Predictive modeling of obesity status using lipidomic data.
(A) A decision tree. Visualization highlights key lipids separating obese from lean individuals. (B) Random forest confusion matrices display predictive performance for obesity. (C) Feature importance plots rank the contribution of individual lipid species for these classifications. (D) Corresponding table and bar plot of classification accuracy for obesity. (E) ROC curves demonstrate model performance for obesity. Model performance was evaluated using accuracy, sensitivity, specificity, and ROC AUC.
Figure 13
Figure 13. Predictive modeling of diabetes and hypertension.
(A and E) Random forest confusion matrices display predictive performance for diabetes (A) and hypertension (E). (B and F) Feature importance plots rank the contribution of individual lipid species for these classifications. (C and G) Corresponding tables and bar plots of classification accuracy for diabetes (C) and hypertension (G). (D and H) ROC curves demonstrate model performance for diabetes (D) and hypertension (H). Model performance was evaluated using accuracy, sensitivity, specificity, and ROC AUC.
Figure 14
Figure 14. Predictive modeling of dyslipidemia and steatosis.
(A and E) Random forest confusion matrices display predictive performance for dyslipidemia (A) and steatosis (E). (B and F) Feature importance plots rank the contribution of individual lipid species for these classifications. (C and G) Corresponding tables and bar plots of classification accuracy for dyslipidemia (C) and steatosis (G). (D and H) ROC curves demonstrate model performance for dyslipidemia (D) and steatosis (H). Model performance was evaluated using accuracy, sensitivity, specificity, and ROC AUC.
Figure 15
Figure 15. Predictive modeling of vascular dysfunction and inflammation.
(A and E) Random forest confusion matrices display predictive performance for vascular dysfunction (A) and inflammation (E). (B and F) Feature importance plots rank the contribution of individual lipid species for these classifications. (C and G) Corresponding tables and bar plots of classification accuracy for vascular dysfunction (C) and inflammation (G). (D and H) ROC curves demonstrate model performance for vascular dysfunction (D) and inflammation (H). Model performance was evaluated using accuracy, sensitivity, specificity, and ROC AUC.
Figure 16
Figure 16. Pathway enrichment analysis of differential adiposome lipid species.
(A) A Sankey plot visualizes the connection between lipids (labeled with KEGG codes) and enriched KEGG pathways. Each molecule is linked to its associated pathways, with the statistical significance shown in the bubble plot. (B) Bar chart of KEGG enrichment analysis showing the top biological processes related to altered lipids.

Similar articles

Cited by

References

    1. Emmerich SD, et al. Obesity and severe obesity prevalence in adults: United States, August 2021–August 2023. NCHS Data Brief. 2024;(508) doi: 10.15620/cdc/159281. - DOI - PMC - PubMed
    1. Valenzuela PL, et al. Obesity and the risk of cardiometabolic diseases. Nat Rev Cardiol. 2023;20(7):475–494. doi: 10.1038/s41569-023-00847-5. - DOI - PubMed
    1. Agrawal S, et al. BMI-adjusted adipose tissue volumes exhibit depot-specific and divergent associations with cardiometabolic diseases. Nat Commun. 2023;14(1):266. doi: 10.1038/s41467-022-35704-5. - DOI - PMC - PubMed
    1. Bond ST, et al. Adipose-derived extracellular vesicles: systemic messengers and metabolic regulators in health and disease. Front Physiol. 2022;13:837001. doi: 10.3389/fphys.2022.837001. - DOI - PMC - PubMed
    1. Liu W, et al. Adipose tissue-derived extracellular vesicles: a promising biomarker and therapeutic strategy for metabolic disorders. Stem Cells Int. 2023;2023:9517826. doi: 10.1155/2023/7136819. - DOI - PMC - PubMed