. 2025 Jun;14(12):e71001.
doi: 10.1002/cam4.71001.

ER Stress Induced by Artemisinin and Its Derivatives Determines the Susceptibility to Their Synergistic Apoptotic Killing With TRAIL

Affiliations

ER Stress Induced by Artemisinin and Its Derivatives Determines the Susceptibility to Their Synergistic Apoptotic Killing With TRAIL

Snigdha Bhowmick et al. Cancer Med. 2025 Jun.

Abstract

Aim: Artemisinins are a class of antimalarial drugs that are lately being researched for their antitumor activity. We previously reported that artesunate, an artemisinin derivative, can induce ferroptosis and enhance TRAIL (Tumor necrosis factor-Related Apoptosis-Inducing Ligand)-induced apoptosis. Here we investigated the role of endoplasmic reticulum (ER) stress induced by artemisinin and its derivatives, especially in the enhancement of TRAIL-induced apoptosis, which can be exploited for repurposing the use of artemisinins in cancer therapy.

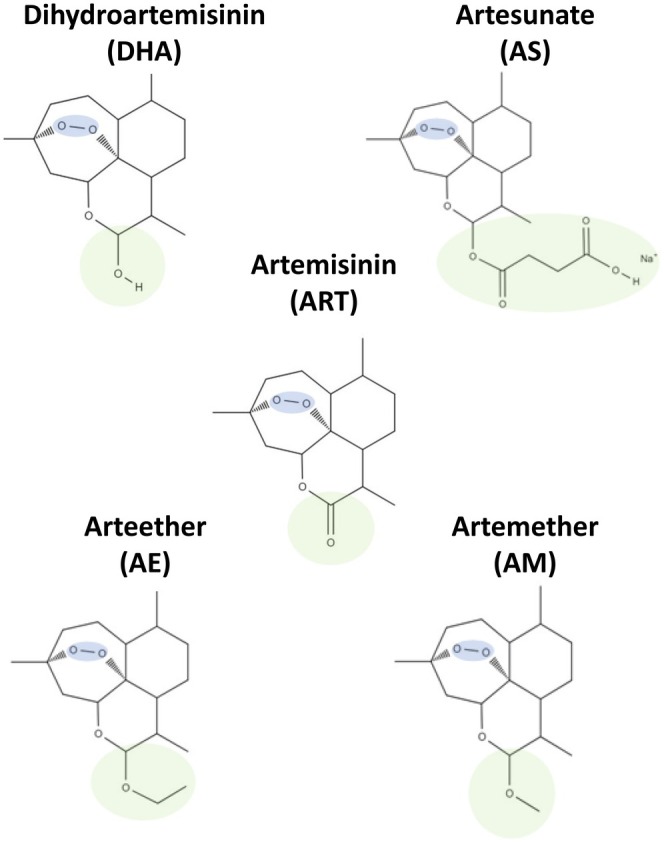
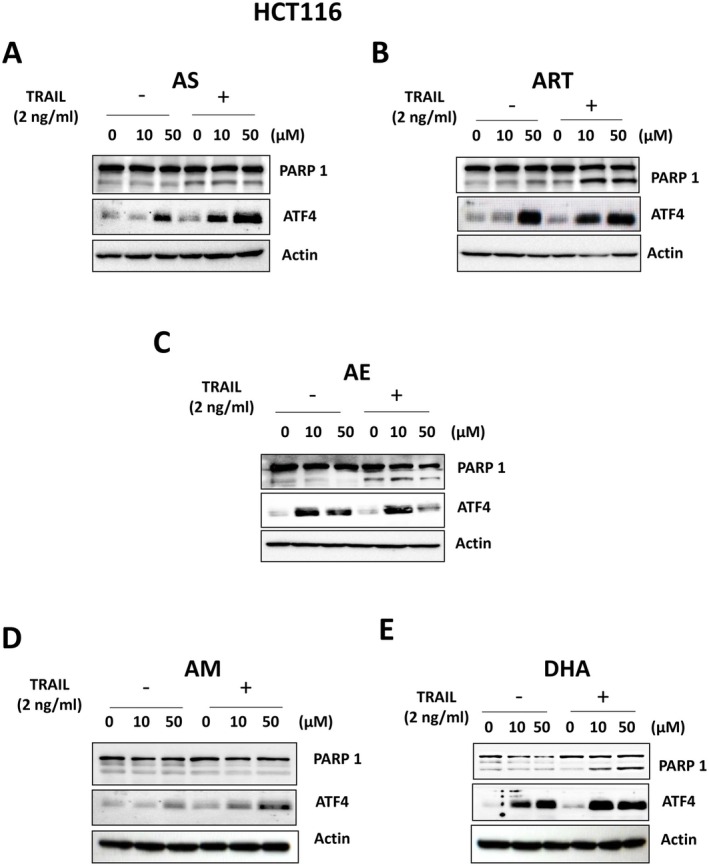
Methods: We show in this study a comparative profile of the ER stress induced by different derivatives of this drug, namely artemisinin, artesunate, arteether, artemether, and dihydroartemisinin, all of which are available readily and approved for treating human patients. These five derivatives were used to treat human colon carcinoma HCT116 cells and pancreatic adenocarcinoma BxPC3 cells over a range of doses.

Results: Our data show a highly significant positive correlation between ER stress caused by these drugs and their corresponding apoptotic susceptibilities upon treatment with TRAIL.

Conclusion: We concluded that dihydroartemisinin is the most effective contender among all the derivatives tested to enhance TRAIL-induced apoptosis.

Keywords: ER stress; apoptosis; artemisinins; cytotoxicity; ferroptosis.


Conflict of interest statement

The authors declare no conflicts of interest.

Figures

FIGURE 1
FIGURE 1
Schematic diagram of chemical structures of all the artemisinin and its derivatives. The chemical features of artemisinins, showing their similarity in the common endoperoxide bridge (highlighted in blue) and differences in the active groups bound to the C10 position (highlighted in green).
FIGURE 2
FIGURE 2
Assessment of artemisinin derivatives‐induced cytotoxicity. HCT116 cells were treated with various concentrations (1–50 μM) of artesunate (AS), artemisinin (ART), arteether (AE), artemether (AM), or dihydroartemisinin (DHA) for 24 h. (A) Phase‐contrast microscopy images were visualized under a light microscope. CON, 1% DMSO treated control cells. (B–F) Cell death was determined using trypan blue exclusion assay. Error bars represent mean +/− SD from triplicate experiments. Cell lysates were analyzed with immunoblotting assay using indicated antibodies. Actin was used as a protein loading control in each lane.
FIGURE 3
FIGURE 3
Effect of artemisinins on TRAIL‐induced apoptosis. HCT116 (A, B) and BxPC‐3 (C) cells were pretreated with artemisinins (1–50 μM) for 20 h and then treated without (−) or with (+) TRAIL (2 ng/mL for HCT116 cells or 10 ng/mL for BxPC‐3 cells) for an additional 4 h. (A) HCT116 cell survival was determined for dose‐dependent treatment with each of the drug with and without TRAIL. Error bars represent mean +/− SD from triplicate experiments. For statistical analysis, Student's t‐test (two‐sided, paired) was used. p values: *, 0.05; **, 0.01; ***, 0.005 and ****, 0.0001. (B, C) Cell lysates were analyzed with immunoblotting assay using indicated antibodies. Actin was used as a protein loading control in each lane.
FIGURE 4
FIGURE 4
Effect of artemisinins on TRAIL‐induced apoptosis. HCT116 cells were pretreated with 50 μM artemisinins (A, control; B, AS; C, ART; D, AE; E, AM; F, DHA) for 20 h and then treated without or with TRAIL (2 ng/mL) for an additional 4 h. Cells were stained with Annexin V‐FITC (green), PI (red), and Hoechst (blue), and analyzed using an ECHO fluorescence microscope. Representative images are shown (scale bar: 100 μm).
FIGURE 5
FIGURE 5
Assessment of ER stress response induced by artemisinins. HCT116 (A) and BxPC‐3 (B) cells were treated with various concentrations (1–100 μM) of artemisinin derivatives for 24 h. Whole‐cell lysates were analyzed using immunoblotting assay with indicated antibodies. Actin was used as a protein loading control in each lane.
FIGURE 6
FIGURE 6
Comparison of ER stress response in artemisinin derivatives‐enhanced TRAIL‐induced apoptosis. (A–E) HCT116 cells were pretreated with various concentrations (10 or 50 μM) of artemisinins for 20 h and treated with or without 2 ng/mL TRAIL for an additional 4 h. PARP‐1 cleavage and ATF4 expression were analyzed by immunoblotting with respective antibodies for each drug.
FIGURE 7
FIGURE 7
Comparison of ER stress response in AS, DHA, and AM. HCT116 (A) and BxPC‐3 (B) cells were treated with various concentrations (1–50 μM) of AS, DHA, or AM for 24 h. Whole‐cell lysates were analyzed using immunoblotting assay with indicated antibodies. Actin was used as a protein loading control in each lane.
FIGURE 8
FIGURE 8
Role of CHOP in artemisinin derivatives‐enhanced TRAIL‐induced apoptosis. HCT116 cells were transfected with siRNA (50 nM) of CHOP for 24 h. After transfection, cells were pretreated with 50 μM artemisinins (A, AS; B, DHA; C, AM) for 20 h and then treated without or with TRAIL (2 ng/mL) for an additional 4 h. Whole‐cell lysates were analyzed using immunoblotting assay with indicated antibodies. Actin was used as a protein loading control in each lane.
FIGURE 9
FIGURE 9
Correlation between PARP cleavage and ATF4 gene expression during treatment with artemisinins and TRAIL. Data from Figures 3, 5, and 6 are summarized. (A) Bar graphs showing the normalized expression levels of ATF4 and cleaved PARP‐1, highlighting their correlation in HCT116 cells treated with 50 μM artemisinin and 2 ng/mL TRAIL. (B) The expression of cleaved PARP and ATF4 for treatments over different concentrations with the five different artemisinins in HCT116 and BxPC‐3 cells is plotted; correlation coefficient, R and p value is indicated for analyses of experimental data in triplicates.

Similar articles

References

    1. Dixon S. J., Lemberg K. M., Lamprecht M. R., et al., “Ferroptosis: An Iron‐Dependent Form of Nonapoptotic Cell Death,” Cell 149 (2012): 1060–1072, 10.1016/j.cell.2012.03.042. - DOI - PMC - PubMed
    1. Magtanong L., Ko P. J., and Dixon S. J., “Emerging Roles for Lipids in Non‐Apoptotic Cell Death,” Cell Death and Differentiation 23 (2016): 1099–1109, 10.1038/cdd.2016.25. - DOI - PMC - PubMed
    1. Shimada K., Skouta R., Kaplan A., et al., “Global Survey of Cell Death Mechanisms Reveals Metabolic Regulation of Ferroptosis,” Nature Chemical Biology 12 (2016): 497–503, 10.1038/nchembio.2079. - DOI - PMC - PubMed
    1. Yang W. S., Kim K. J., Gaschler M. M., Patel M., Shchepinov M. S., and Stockwell B. R., “Peroxidation of Polyunsaturated Fatty Acids by Lipoxygenases Drives Ferroptosis,” Proceedings of the National Academy of Sciences of the United States of America 113 (2016): E4966–E4975, 10.1073/pnas.1603244113. - DOI - PMC - PubMed
    1. Yang W. S. and Stockwell B. R., “Ferroptosis: Death by Lipid Peroxidation,” Trends in Cell Biology 26 (2016): 165–176, 10.1016/j.tcb.2015.10.014. - DOI - PMC - PubMed

MeSH terms

LinkOut - more resources