. 2025 May 1;26(3):bbaf283.
doi: 10.1093/bib/bbaf283.

IECata: interpretable bilinear attention network and evidential deep learning improve the catalytic efficiency prediction of enzymes

Affiliations

IECata: interpretable bilinear attention network and evidential deep learning improve the catalytic efficiency prediction of enzymes

Jingjing Wang et al. Brief Bioinform. .

Abstract

Enzyme catalytic efficiency (kcat/Km) is a key parameter for identifying high-activity enzymes. Recently, deep learning techniques have demonstrated the potential for fast and accurate kcat/Km prediction. However, three challenges remain: (i) the limited size of the available kcat/Km dataset hinders the development of deep learning models; (ii) the model predictions lack reliable confidence estimates; and (iii) models lack interpretable insights into enzyme-catalyzed reactions. To address these challenges, we proposed IECata, a kcat/Km prediction model that provides uncertainty estimation and interpretability. IECata collected a dataset of 11 815 kcat/Km entries from the BRENDA and SABIO-RK databases, along with an out-of-domain test dataset of 806 entries from the literature. By introducing evidential deep learning, IECata provides uncertainty estimates for kcat/Km predictions. Moreover, it uses a bilinear attention mechanism to focus on learning crucial local interactions to interpret the key residues and substrate atoms in enzyme-catalyzed reactions. Testing results indicate that the prediction performance of IECata exceeds that of state-of-the-art benchmark models. More importantly, it provides a reliable confidence assessment for these predictions. Case studies further highlight that the incorporation of uncertainty in screening for highly active enzymes can effectively increase the hit ratio, thereby improving the efficiency of experimental validation and accelerating directed enzyme evolution. To facilitate researchers' use of IECata, we have developed an online prediction platform: http://mathtc.nscc-tj.cn/cataai/.

Keywords: k cat/Km prediction; bilinear attention mechanism; evidential deep learning; interpretability; uncertainty.


Figures

Figure 1
Figure 1
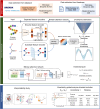
The framework of the proposed IECata.
Figure 2
Figure 2
Performance of IECata on the in-domain test dataset. (a) Performance of IECata on the whole in-domain test dataset. (b) Performance of IECata on the in-domain test dataset of wild-type enzymes. (c) Performance of IECata on the in-domain test dataset of mutant enzymes. (d) Comparison of IECata’s and UniKP’s performances by 5CV on the whole dataset, n = 5 independent trials. The brightness of color represents the density of data points. Student’s t-test was used to calculate the P value for the PCC. N represents the number of entries in the test dataset.
Figure 3
Figure 3
Uncertainty analysis of IECata on the in-domain test dataset. (a) Expected cumulative distribution against the observed cumulative distribution for IECata on the in-domain test dataset. The dashed line represents perfect calibration. Mean ± 95% CI, n = 5 independent trials. (b) RMSE at different uncertainty percentile cutoffs for IECata evaluated on the in-domain test dataset. Mean ± 95% CI, n = 5 independent trials. (c) Independent samples t-test on absolute error distributions for epistemic, aleatoric, and total uncertainty in two groups: top 25% uncertainty values and bottom 25% uncertainty values. All P values <.001.
Figure 4
Figure 4
Quantitative assessment of uncertainty calibration. (a) Comparison of IECata and model with random uncertainty on NLL values. (b) The Spearman’s rank correlation coefficient value of IECata. (c) The Spearman’s rank correlation coefficient value of the model with random uncertainty.
Figure 5
Figure 5
Performance of IECata and UniKP on the out-of-domain independent test dataset. (a) Performance of the IECata model on the out-of-domain independent test dataset. (b) Performance of the UniKP model, trained on the IECata training dataset, on the out-of-domain independent test dataset. (c) Performance of the model provided by UniKP on the out-of-domain test dataset. (d) RMSE at different uncertainty percentile cutoffs for IECata evaluated on the out-of-domain test dataset. The brightness of color represents the density of data points. Student’s t-test was used to calculate the P value for PCC. N represents the number of entries in the test dataset.
Figure 6
Figure 6
Comparing the predicted HRs of three different sorting strategies on the enzyme-directed evolution dataset.
Figure 7
Figure 7
Visualization of substrates and binding pockets for interpretability study. The visualization results for 6ONM. From left to right, the surface structure of the 6ONM binding pocket, the predicted crucial residues within the pocket (labeled in blue for the substrate and in red for crucial residues), the 2D interaction maps of the binding pocket, and the crucial atoms of the substrate structure (labeled in orange for the crucial atoms). Binding pocket 3D structures were visualized using PyMOL. The 2D interaction maps were visualized using molecular operating environment (MOE) software, and all the substrate structures were visualized using RDKit. Panels (b) and (c) are the visualization results of structures 5IK0 and 3P5R, respectively.
Figure 8
Figure 8
Validation of bilinear attention for identifying key residues in the enzyme-directed evolution datasets. (a) Attention weights for epi-isozizaene synthase mutant residues. (b) Attention weights for germacrene A synthase mutant residues. (c) Attention weights for borneol synthase mutant residues. (d) Attention weights for myrcene synthase mutant residues. Red dashed lines: key mutations with kcat/Km or product yield changing by more than one magnitude from wild type. Black dashed lines: sub-key mutations with changes less than one magnitude from wild type. Solid curves: attention weights.
Figure 9
Figure 9
Quantitative validation of bilinear attention for identifying key residues. (a) Profile of simulated consistency numbers between the top 25 attention sites and randomly generated binding sites. (b) Effect of shifting attention sites on experimental consistency numbers and their z-score values.

Similar articles

References

    1. Packer MS, Liu DR. Methods for the directed evolution of proteins. Nat Rev Genet 2015;16:379–94. 10.1038/nrg3927 - DOI - PubMed
    1. Haber JE. DNA recombination: The replication connection. Trends Biochem Sci 1999;24:271–5. 10.1016/S0968-0004(99)01413-9 - DOI - PubMed
    1. Chronopoulou EG, Labrou NE. Site-saturation mutagenesis: a powerful tool for structure-based design of combinatorial mutation libraries. Curr Protoc Protein Sci 2011;26:26.6.1–10. - PubMed
    1. Holm M, Mandava CS, Ehrenberg M. et al. The mechanism of error induction by the antibiotic viomycin provides insight into the fidelity mechanism of translation. eLife 2019;8:e46124. 10.7554/eLife.46124 - DOI - PMC - PubMed
    1. Eisenthal R, Danson MJ, Hough DW. Catalytic efficiency and kcat/KM: a useful comparator? Trends Biotechnol 2007;25:247–9. 10.1016/j.tibtech.2007.03.010 - DOI - PubMed